INTERIM REPORT 3 (2020-11-01 – 2021-01-31)
Phase Holographic Imaging PHI AB (publ)
Lund, March 16th, 2021
November 2020 – January 2021
| Net sales | 770 (1 764) KSEK |
| Operating result before depreciation (EBITDA) | -3 719 ( -3 906) KSEK |
| Net result | -5 531 (-5 858) KSEK |
| Earnings per share | -0.38 (-0.41) SEK |
| Gross margin | 54 (59) % |
May 2020 – January 2021
| Net sales | 1 727 (3 246) KSEK |
| Operating result before depreciation (EBITDA) | -11 214 ( -14 103) KSEK |
| Net result | -16 725 (-19 775) KSEK |
| Earnings per share | -1.16 (-1.37) SEK |
| Gross margin | 64 (61) % |
In short
- The second wave of the pandemic restricted sales during the 3rd quarter.
- However, the situation has improved significantly since late January.
- Unless a third wave restricts sales again, it is anticipated that sales during the 4th quarter will compensate for the postponed sales of the 3rd quarter.
- Since last summer, the company has worked intensively to prepare for the post-pandemic market by developing digital sales & marketing and accelerating the development of the HoloMonitor fluorescence module.
CEO commentary
As predicted by many, the winter brought a second wave of the pandemic, which perfectly coincided with our 3rd quarter (November – January). Again, customer labs closed, and the staff was once more sent home to weather the pandemic.
Fortunately, the situation has improved considerably since the second wave began to subside in late January. Labs have now started to reopen, which has allowed us to resume onsite sales activities in the US. Unless yet another wave forces customer labs to close a third time, we anticipate that sales during our 4th and final fiscal quarter will compensate for the delayed sales due to the second wave during the 3rd quarter.
The “new normal”
The new normal will be different from the old normal. The old and familiar way of selling and marketing products between businesses through tradeshow and physical sales calls will change. It is likely that also after the pandemic, physical customer visits will be limited to demonstrations and product installations that require physical presence.
The pandemic has taught us how much more cost-effective the new normal of digital marketing and online sales are. In the new normal, a face-to-face sales call is achieved in an hour or so, no matter where the customer is located. Few will want to go back to when a sales call involved more expenses, traveling and CO2 emissions than spending time with the customer.
Approximately 450 million additional vaccine doses need to be administered to fully vaccinate 75% of the United States population. At the current vaccination rate of 2 million doses per day, we can look forward to the beginning of the end of the pandemic and the “new normal” in the world’s largest market by fall this year.
Source: covid.cdc.gov/covid-data-tracker
Since last summer, we have worked intensively to take advantage of the new normal by completely switching to digital sales and marketing, but also by accelerating the development of the sought-after fluorescence module.
Digital sales & marketing
Digital sales & marketing essentially means that everything that can be done online shall be done online — from lead generation to service. The wealth of statistical data makes it possible to predict the effect and result of marketing campaigns, which is already practiced today within e-commerce and social media.
The graph below displays the number of visits to phiab.com per week from our Google Search adverts. It also displays how many of these visitors show an interest in our products by actively interacting with the website.

Suppose it is possible to determine a relationship between the two curves and increased revenues. It would then be possible to determine the needed investment in digital advertising to achieve the desired revenue increase. The possibility of predicting future revenues through statistical data analysis is something we certainly intend to explore further.
The fluorescence project
To find cures for non-infectious diseases like cancer and Alzheimer’s, it is critical to understand what role our genes play in such diseases. Fluorescence labeling of cells is the go-to method to study the genetic activity of cells.
However, fluorescence labeling has a significant disadvantage. The method is toxic to the cells and thus changes the behavior that the method is intended to observe, which of course reduces the value of the research results.
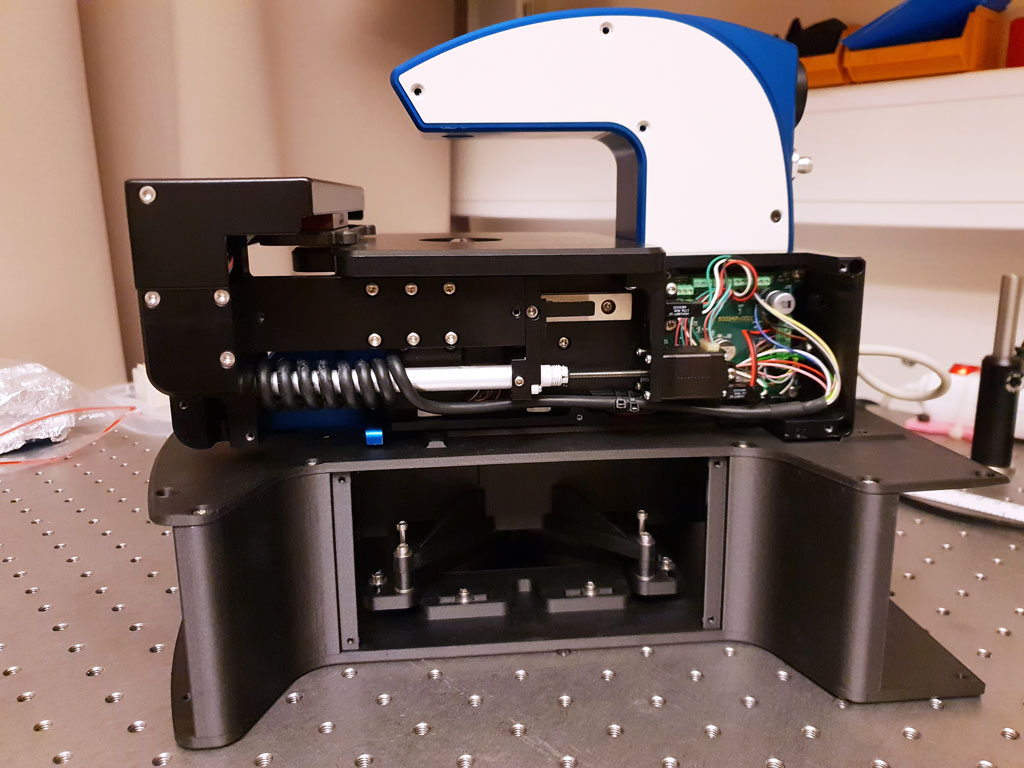
To date, there has been no good solution to this problem. The integration of holographic and fluorescence microscopy in a single instrument solves this long-standing issue.
The combination of the two techniques reduces the number of fluorochromes that need to be added and the need to activate added fluorochromes, which means that the negative effect the fluorescence labeling has on the cells is reduced to a minimum.
After an initial proof-of-concept, the first prototype of such an instrument has now been manufactured using 3D-printing techniques (above). The fluorescence project now enters a phase of internal testing, technical iterations, and software development. When circumstances so permit, this will be followed by external evaluations of pre-production units at Lund University Cancer Centre and National Institute on Aging in Baltimore, among others.

Digital sales & marketing will fundamentally change the way business is done in our part of the life science industry. In the new normal, technology providers like PHI will take the front seat and control how their products are sold and marketed, which wasn’t the case in the old normal.
Peter Egelberg, CEO
In the spirit of doing everything online that can be done online, this report has been written online and directly in HTML. This and future reports can be comfortably read on any device, including the financial tables. Those who prefer to print and read the report on paper can do so by pressing the button below.
Net sales and result
Net sales for the third quarter amounted to 770 (1 764) KSEK and operating result before depreciation (EBITDA) to -3 719 (-3 906) KSEK. Net result amounted to -5 531 (-5 858) KSEK.
Investments
With an emphasis on application development and development of fluorescence capability, the company invested 1 000 (862) KSEK in product, patent and application development during the period.
Financing
Cash, cash equivalents and unutilized granted credits amounted to 36 631 (22 663) KSEK by the end of the period. The equity ratio was 55 (82) %.
Rolling 12-month sales with trendline
Risks
The company may be affected by various factors, described in the 2019/20 Annual Report. These factors may individually or jointly increase risks for the operation and result of the company.
Accounting principles
The accounts are prepared in accordance with the Annual Accounts Act and general advice from the Swedish Accounting Standards Board BFNAR 2012:1 Annual accounts and consolidated accounts (K3).
Review
This interim report has not been subject to review by the company’s auditor.
Statements about the future
Statements concerning the company’s business environment and the future in this report reflect the board of director’s current view of future events and financial developments. Forward-looking statements only express the judgments and assumptions made by the board of directors on the day of the report. These statements have been carefully assessed. However, it is brought to the reader’s attention that these statements are associated with uncertainty, like all statements about the future.
Calendar
June 24, 2021 Year-end report
About Phase Holographic Imaging
Phase Holographic Imaging (PHI) leads the ground-breaking development of time-lapse cytometry instrumentation and software. With the first HoloMonitor-instrument introduced in 2011, the company today offers a range of products for long-term quantitative analysis of living cell dynamics that circumvent the drawbacks of traditional methods requiring toxic stains. Headquartered in Lund, Sweden, PHI trades through a network of international distributors. Committed to promoting the science and practice of time-lapse cytometry, PHI is actively expanding its customer base and scientific collaborations in cancer research, inflammatory and autoimmune diseases, stem cell biology, gene therapy, regenerative medicine and toxicological studies.
On behalf of the Board of Directors
Peter Egelberg, CEO
For additional information please contact:
Peter Egelberg
Tel: +46 703 19 42 74
E-mail: ir@phiab.se
Web: www.phiab.com
Consolidated – PHI Group
Income statement (KSEK)
| Q3 | Q3 | YTD | YTD | FY | |
| 2020/21 | 2019/20 | 2020/21 | 2019/20 | 2019/20 | |
| Net sales | 770 | 1 764 | 1 727 | 3 246 | 3 803 |
| Cost of products sold | -352 | -721 | -699 | -1 275 | -1 500 |
| Gross profit | 418 | 1 043 | 1 028 | 1 971 | 2 303 |
| Gross margin | 54% | 59% | 64% | 61% | 61% |
| Selling expenses | -1 780 | -2 395 | -5 262 | -6 545 | -8 756 |
| Administrative expenses | -1 450 | -1 668 | -5 309 | -4 852 | -6 428 |
| R&D expenses | -2 988 | -2 725 | -9 149 | -10 150 | -13 538 |
| Operating income | 249 | 1 972 | 367 | ||
| Operating result (EBIT) | -5 551 | -5 745 | -16 720 | -19 576 | -26 052 |
| Financial net | 20 | -113 | -5 | -199 | -261 |
| Result before tax (EBT) | -5 531 | -5 858 | -16 725 | -19 775 | -26 313 |
| Net Result (EAT) | -5 531 | -5 858 | -16 725 | -19 775 | -26 313 |
Balance sheet (KSEK)
| Q3 | Q3 | FY | |
| 2020/21 | 2019/20 | 2019/20 | |
| ASSETS | |||
| Non-current assets | |||
| Intangible assets | 14 213 | 17 488 | 16 735 |
| Tangible assets | 427 | 817 | 704 |
| Total non-current assets | 14 640 | 18 305 | 17 439 |
| Current Assets | |||
| Inventory | 1 661 | 1 720 | 1 530 |
| Short-term receivables | 2 546 | 2 321 | 2 590 |
| Cash and equivalents | 3 381 | 20 663 | 14 484 |
| Total current assets | 7 588 | 24 704 | 18 604 |
| Total assets | 22 228 | 43 009 | 36 043 |
| EQUITY AND LIABILITIES | |||
| Equity | 12 174 | 35 381 | 28 896 |
| Financial liabilities | 4 250 | 750 | 1 125 |
| Operating liabilities | 5 804 | 6 878 | 6 022 |
| Total equity and liabilities | 22 228 | 43 009 | 36 043 |
Changes in equity (KSEK)
| Q3 | Q3 | FY | |
| 2020/21 | 2019/20 | 2019/20 | |
| Opening Balance | 17 675 | 40 777 | 37 653 |
| Equity issues, net | 445 | 17 487 | |
| Net profit | -5 531 | -5 858 | -26 313 |
| Translation difference | 30 | 17 | 69 |
| Closing balance | 12 174 | 35 381 | 28 896 |
| Equity ratio | 55% | 82% | 80% |
Cash flow analysis (KSEK)
| Q3 | Q3 | YTD | YTD | FY | |
| 2020/21 | 2019/20 | 2020/21 | 2019/20 | 2019/20 | |
| Operating activities | |||||
| Net result | -5 531 | -5 858 | -16 725 | -19 775 | -26 313 |
| Depreciation | 1 832 | 1 839 | 5 506 | 5 521 | 7 360 |
| Translation difference | 79 | ||||
| Operating cash flow | -3 699 | -4 019 | -11 219 | -14 254 | -18 896 |
| Increase (-)/decrease (+) in inventories | -57 | -569 | -131 | -338 | -148 |
| Increase (-)/decrease (+) in operating receivables | 435 | 548 | -35 | 102 | -88 |
| Increase (+)/decrease (-) in operating liabilities | -298 | -79 | -139 | -574 | -1 272 |
| Change in working capital | 80 | -100 | -305 | -810 | -1 508 |
| Cash flow from operating activities | -3 619 | -4 119 | -11 524 | -15 064 | -20 404 |
| Investing activities | |||||
| Development expenses | -1 000 | -862 | -2 707 | -2 015 | -2 729 |
| Patents | -204 | -266 | |||
| Tangible assets | -175 | ||||
| Cash flow after investments | -4 589 | -4 981 | -14 231 | -17 283 | -23 653 |
| Financing activities | |||||
| Net proceeds from equity issues | 445 | 3 | 17 740 | 17 487 | |
| Increase (+)/decrease (-) in borrowings | -375 | -375 | 3 125 | -1 125 | -750 |
| Cash flow from financing activities | -375 | 70 | 3 128 | 16 615 | 16 737 |
| Cash flow for the period | -4 964 | -4 911 | -11 103 | -668 | -6 847 |
| Cash and cash equivalents at the beginning of the period | 8 345 | 25 574 | 14 484 | 21 331 | 21 331 |
| Cash and cash equivalents at the end of the period | 3 381 | 20 663 | 3 381 | 20 663 | 14 484 |
| (Incl. unutilized credits) | 36 631 | 22 663 | 36 631 | 22 663 | 16 484 |
Data per share
| Q3 | Q3 | YTD | YTD | FY | |
| 2020/21 | 2019/20 | 2020/21 | 2019/20 | 2019/20 | |
| Earnings per Share, SEK | -0.38 | -0.41 | -1.16 | -1.37 | -1.83 |
| Equity per share, SEK | 1.23 | 2.62 | 1.23 | 1.54 | 2.01 |
| Number of Shares, end of period | 14 394 971 | 14 394 971 | 14 394 971 | 14 394 971 | 14 394 971 |
| Average number of shares | 14 394 971 | 14 392 908 | 14 394 971 | 14 383 755 | 14 386 521 |
| Share price end of period | 25.30 | 36.40 | 25.30 | 36.40 | 36.40 |
Parent company
Income statement (KSEK)
| Q3 | Q3 | YTD | YTD | FY | |
| 2020/21 | 2019/20 | 2020/21 | 2019/20 | 2019/20 | |
| Net sales | 449 | 1 764 | 1 586 | 3 159 | 3 716 |
| Cost of products sold | -101 | -721 | -682 | -1 275 | -1 502 |
| Gross profit | 348 | 1 043 | 904 | 1 884 | 2 214 |
| Gross margin | 78% | 59% | 57% | 60% | 60% |
| Selling expenses | -1 316 | -2 395 | -3 719 | -6 545 | -8 756 |
| Administrative expenses | -1 450 | -1 616 | -5 309 | -4 740 | -5 814 |
| R&D expenses | -2 988 | -2 725 | -9 149 | -10 150 | -13 538 |
| Other Income | 249 | 1 972 | 367 | ||
| Operating result (EBIT) | -5 157 | -5 693 | -15 301 | -19 551 | -25 527 |
| Financial net | 20 | -113 | -5 | -199 | -261 |
| Result before tax (EBT) | -5 137 | -5 806 | -15 306 | -19 750 | -25 788 |
| Net Result (EAT) | -5 137 | -5 806 | -15 306 | -19 750 | -25 788 |
Balance sheet (KSEK)
| Q3 | Q3 | FY | |
| 2020/21 | 2019/20 | 2019/20 | |
| ASSETS | |||
| Non-current assets | |||
| Intangible assets | 14 213 | 17 488 | 16 735 |
| Tangible assets | 427 | 817 | 704 |
| Financial assets | 942 | 942 | 942 |
| Total non-current assets | 15 582 | 19 247 | 18 381 |
| Current Assets | |||
| Inventory | 1 452 | 1 720 | 1 530 |
| Short-term receivables | 4 052 | 2 275 | 2 648 |
| Cash and equivalents | 2 996 | 19 774 | 13 940 |
| Total current assets | 8 500 | 23 769 | 18 118 |
| Total assets | 24 082 | 43 016 | 36 499 |
| EQUITY AND LIABILITIES | |||
| Equity | 14 045 | 35 389 | 29 352 |
| Financial liabilities | 4 250 | 750 | 1 125 |
| Operating liabilities | 5 787 | 6 877 | 6 022 |
| Total equity and liabilities | 24 082 | 43 016 | 36 499 |
