
Kinetic Dose Response Assay
Your real-time and time-saving kinetic dose response assay
The label-free HoloMonitor® Kinetic Dose Response Assay enables direct measurement of drug dose-response curves over time. It is designed for automated and detailed analysis of drug dose responses in adherent cells. Furthermore, the powerful algorithms immediately generate dose-response curves for easy comparison between the treated and untreated groups.
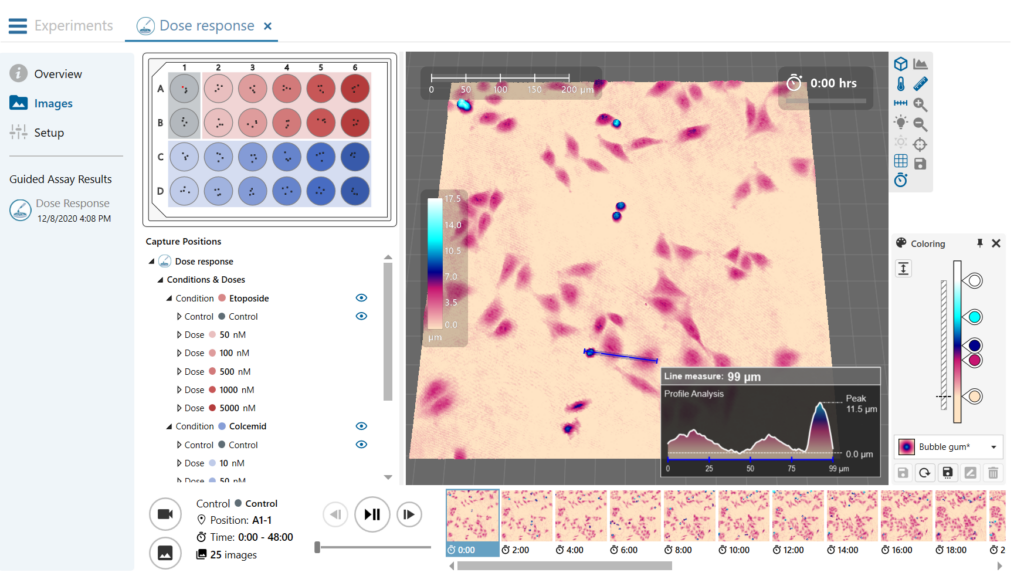
The time-lapse videos show L929 cells untreated and drug-treated with 10 µM etoposide.
Benefits
Why choose the HoloMonitor Dose Response Assay?
Time-saving
Support up to 96-well plate format, enabling a range of time points and concentrations in one experiment.
Real-time curve
Powerful algorithms automatically generate dose-response curves for kinetics drug effects and toxicity patterns.
Direct measurement
Dose-response curve based on direct cell count overtime for much more consistent results.
Multiple results
Get multiple results from just one single experiment, hence, save your time, money, and cells.
Assay Output
What results do you get with the in vitro Dose Response Assay?
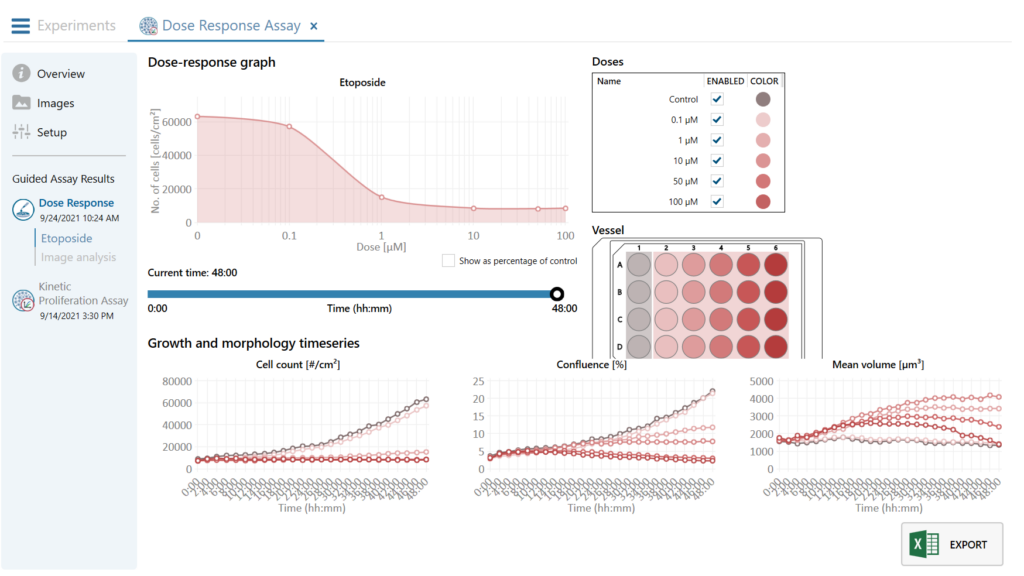
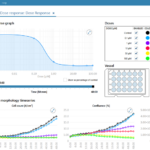
Results are displayed as an interactive dose-response curve, where results for each condition can be displayed for any selected time-point. In addition, the software will provide you with the end data at user-selected intervals:
- Automatic and interactive dose-response curve.
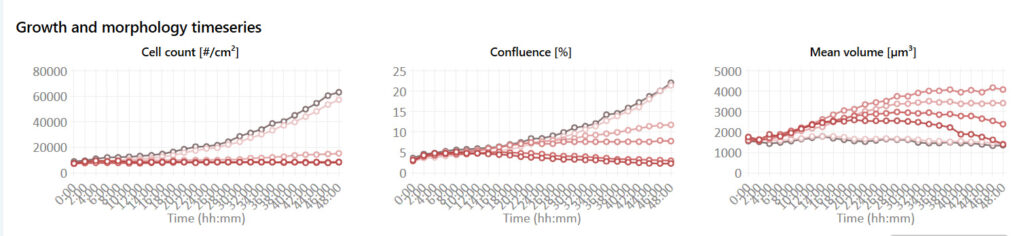
- Kinetic cellular parameters by
- Cell count (cells/cm2)
- Confluence (%)
- Mean volume (µm3)
- Cell images and time-lapse videos.
Watch the interactive and automatic dose-response curve

Time-saving.
Set up one single experiment for all time points
Cell-based drug screening plays an important role both in basic biomedical research and in drug discovery. Yet, it is time and labor-consuming since drug dose-response usually requires a range of compounds, concentrations, and time points. However, with HoloMonitor, we support up to 96-well vessels, allow you to test multiple compounds, concentrations, and time points in just one single experiment. In other words, you never need to set up multiple experiments to cover all the concentrations and time points. Thus, save your time and money. Additionally, our App Suite software provides guided assay workflows to reduce your hands-on lab time, and increase the reproducibility of your experiments.
Human prostate cancer cell (DU145) dies from etoposide drug treatment.
On-demand Webinar
Watch our webinar series — Relevant Conditions Relevant Answers
Learn more about the HoloMonitor Dose Response Assay and how HoloMonitor can contribute to in vitro drug development.
Key Applications
What can you study with HoloMonitor Dose Response Assay?
Drug discovery & development
Compounds profiling
Pharmacodynamic studies
Pharmacokinetics studies
Toxicology
Oncology

Real-time curve.
Interactive dose response curve generated in real-time
Dose-response curves are routinely generated to assess the effect of drugs and other compounds. The assay is designed to automatically generate a real-time dose-response curve from a single in vitro experiment to save you time and money. In addition, the dose-response curve is interactive, where results for each condition can be displayed for any selected time point using the timeline. Besides the dose-response relationship, associated changes in basic morphology are also given. You can also re-analyze your data with other live cell assays. All data is easily exported to Excel for further analysis.
Dose Response Assay Protocol
What results do you get with the dose response assay?
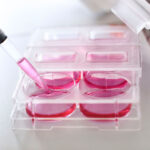
1. Sample preparation
- Seed unlabeled adherent cells in your standard cell culture vessel.
- Use HoloLids for best image quality and data acquisition.
- Then, place the cell culture vessel in the incubator onto the HoloMonitor motorized stage.
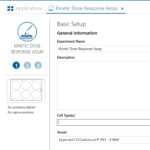
2. Assay setup
- Select the HoloMonitor Dose Response Assay in the software. Next, name your experiment and define treatments.
- Then selecting wells, imaging positions, duration, and interval. Start imaging and walk away!
3. Explore results
- Get real-time dose-response curve by cell count. Analyze the experiment with other live cell assays for further studies.
- Export the raw data for further analysis. Re-use the cells for other experiments!

Direct measurement.
Direct quantitative assessment of the dose-response relationship
Unlike traditional dose-response assays, such as absorbance/ fluorescence or luminescence assays, HoloMonitor Dose-response Assay uses quantitative phase imaging (QPI) to identify cells and generate the dose-response curve directly by cell count. Therefore, eliminating background noises between different samples and cell lines results in reproducible results of drug effects across experiments. Furthermore, you will receive cell count, confluence, and mean cell volume over time, including statistics for each treatment.
How to set up a dose-response assay step-by-step
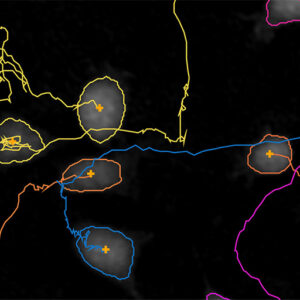
Multiple results.
Get much more results from one single experiment
Many cellular parameters are important for profiling a compound during a drug dose-response relationship study. For example, how do cell motility and proliferation change during a treatment? Is the single-cell behavior the same as for the whole population? However, with HoloMonitor you can always get that information with our live cell assays. Besides that, you can also perform single-cell tracking and morphology study with our in-depth analysis from your dose-response experiment and get more results.

We use the HoloMonitor for studying the effect of drugs on cell morphology, viability, death and motility of cancer cells. With this innovative technique, we can monitor cells over time and get reproducible results that are presented as images, time-lapse movies or diagrams.
PROF. ANETTE GJÖRLOFF WINGREN
FACULTY OF HEALTH AND SOCIETY, MALMÖ UNIVERSITY
Featured Publications
Browse our publication library for more references and see how our worldwide HoloMonitor users run their dose response analysis.

Novel Low-Cytotoxic and Highly Efficient Type I Photoinitiators for Visible LED-/Sunlight-Induced Photopolymerization and High-Precision 3D Printing
Journal: Angewandte Chemie International Edition (2025)
Research Areas: Molecular chemistry
Cell Lines: C3H10 T1/2

Mitochondrial transfer from Adipose stem cells to breast cancer cells drives multi-drug resistance
Journal: Journal of Experimental & Clinical Cancer Research (2024)
Research Areas: Cancer Research
Cell Lines: BCAHC-1, MCF-7 and MDA-MB, 231, MCF-7, MDA-MB, 231 and hASC52telo hTERT cells

In vitro SOD-like activity of mono- and di-copper complexes with a phosphonate substituted SALAN-type ligand
Journal: Chemico – Biological Interactions (2019)
Research Areas: Cytotoxicity
Cell Lines: MC3T3-E1
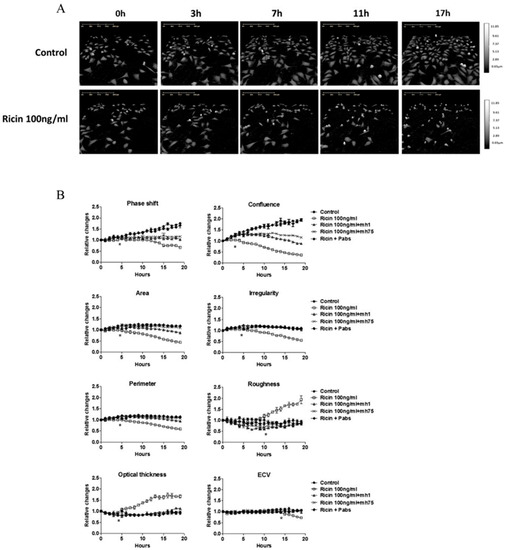
Whole-Cell Multiparameter Assay for Ricin and Abrin Activity-Based Digital Holographic Microscopy
Journal: Toxins (2019)
Research Areas: Cytotoxicity
Cell Lines: HeLa, Vero