App Suite Cell Imaging Software
The HoloMonitor® App Suite cell imaging software facilitates kinetic live-cell tracking and analysis of your cells right from your incubator. In addition to detailed single-cell and cell population data, App Suite provides you with visual data in the form of high-quality images and time-lapse videos of your in vitro cell cultures. Moreover, you can easily re-analyze the imaging results of previous experiments. With the HoloMonitor live cell assays, you can extract multiple results anytime from your samples. And, of course, this cell imaging software allows for convenient data analysis from outside the lab.
Cell Imaging Software
— for and by cell biologists
Cell imaging software can be overly complex and demanding to work with. We developed the App Suite software with its users in mind. The result is a modular, easy-to-use software tool tailored for cell biologists working in the lab.
Get High-quality Visual Data
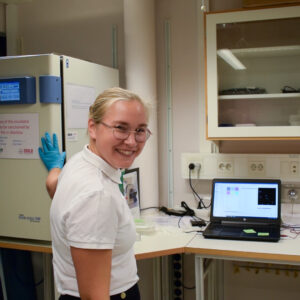
The App Suite cell imaging software enables you direct, non-invasive and real-time monitoring of living cells using the HoloMonitor system.
Meet the App Suite Software
Watch this short video to learn how the HoloMonitor App Suite cell imaging software can help you in your cell lab.
Simpler Live Cell Identification

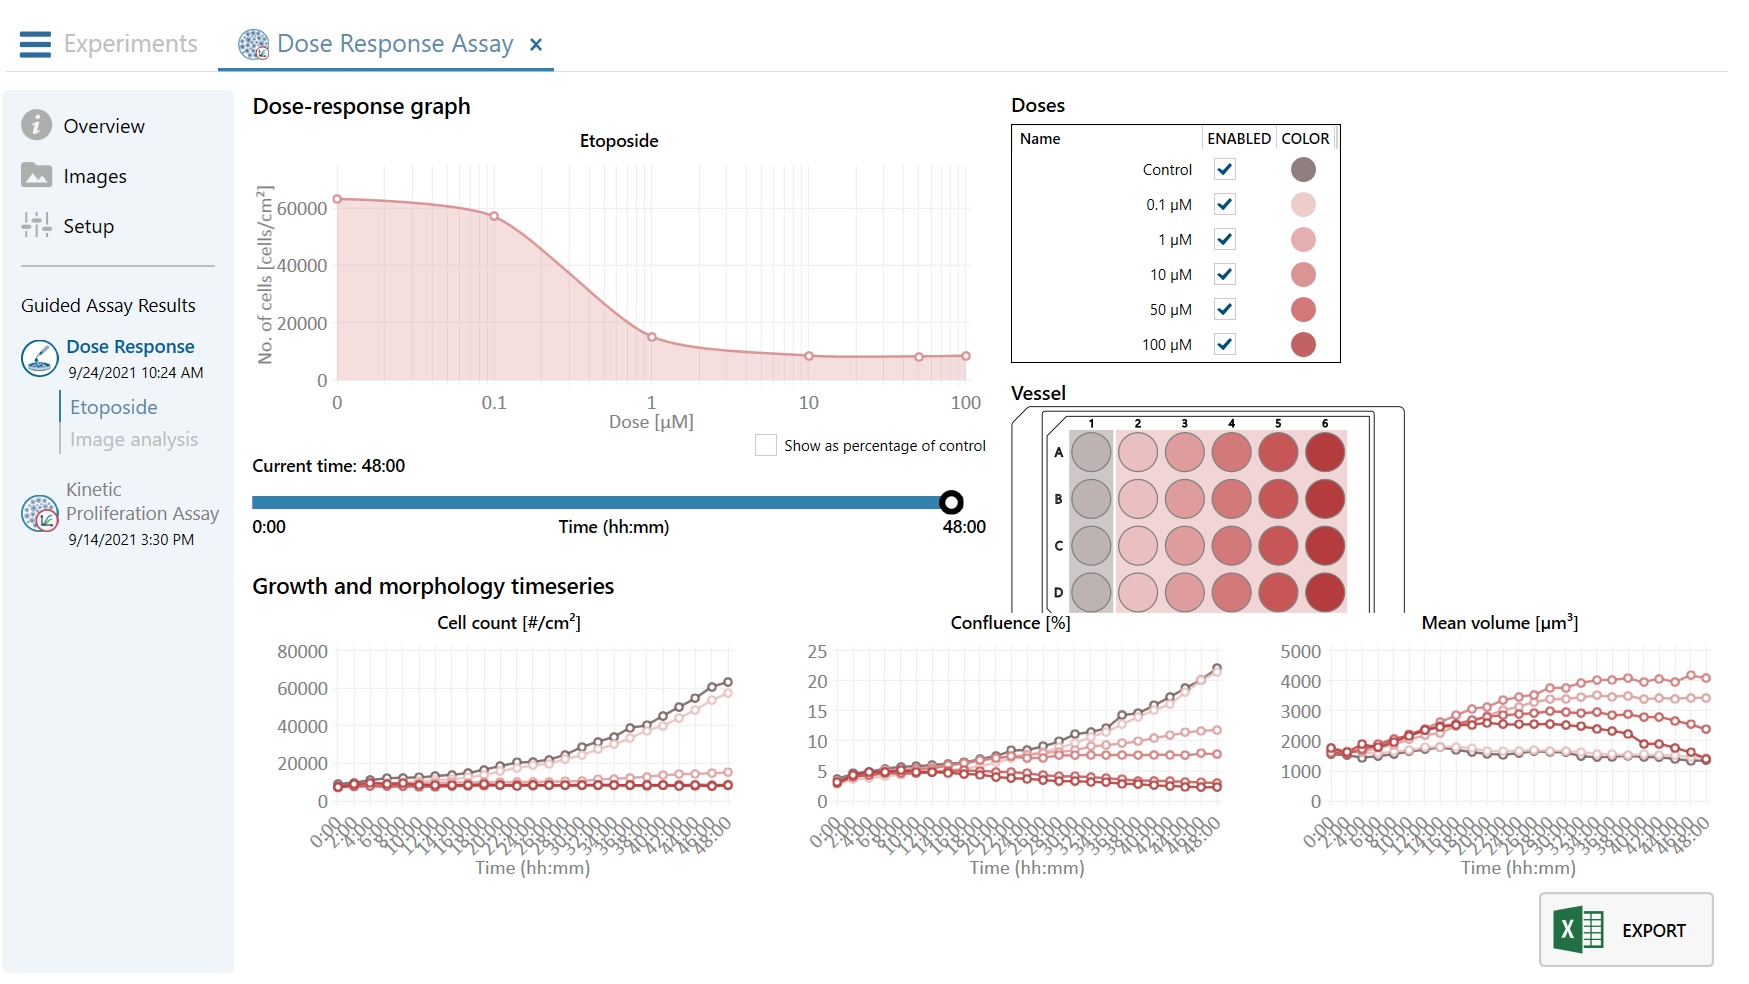
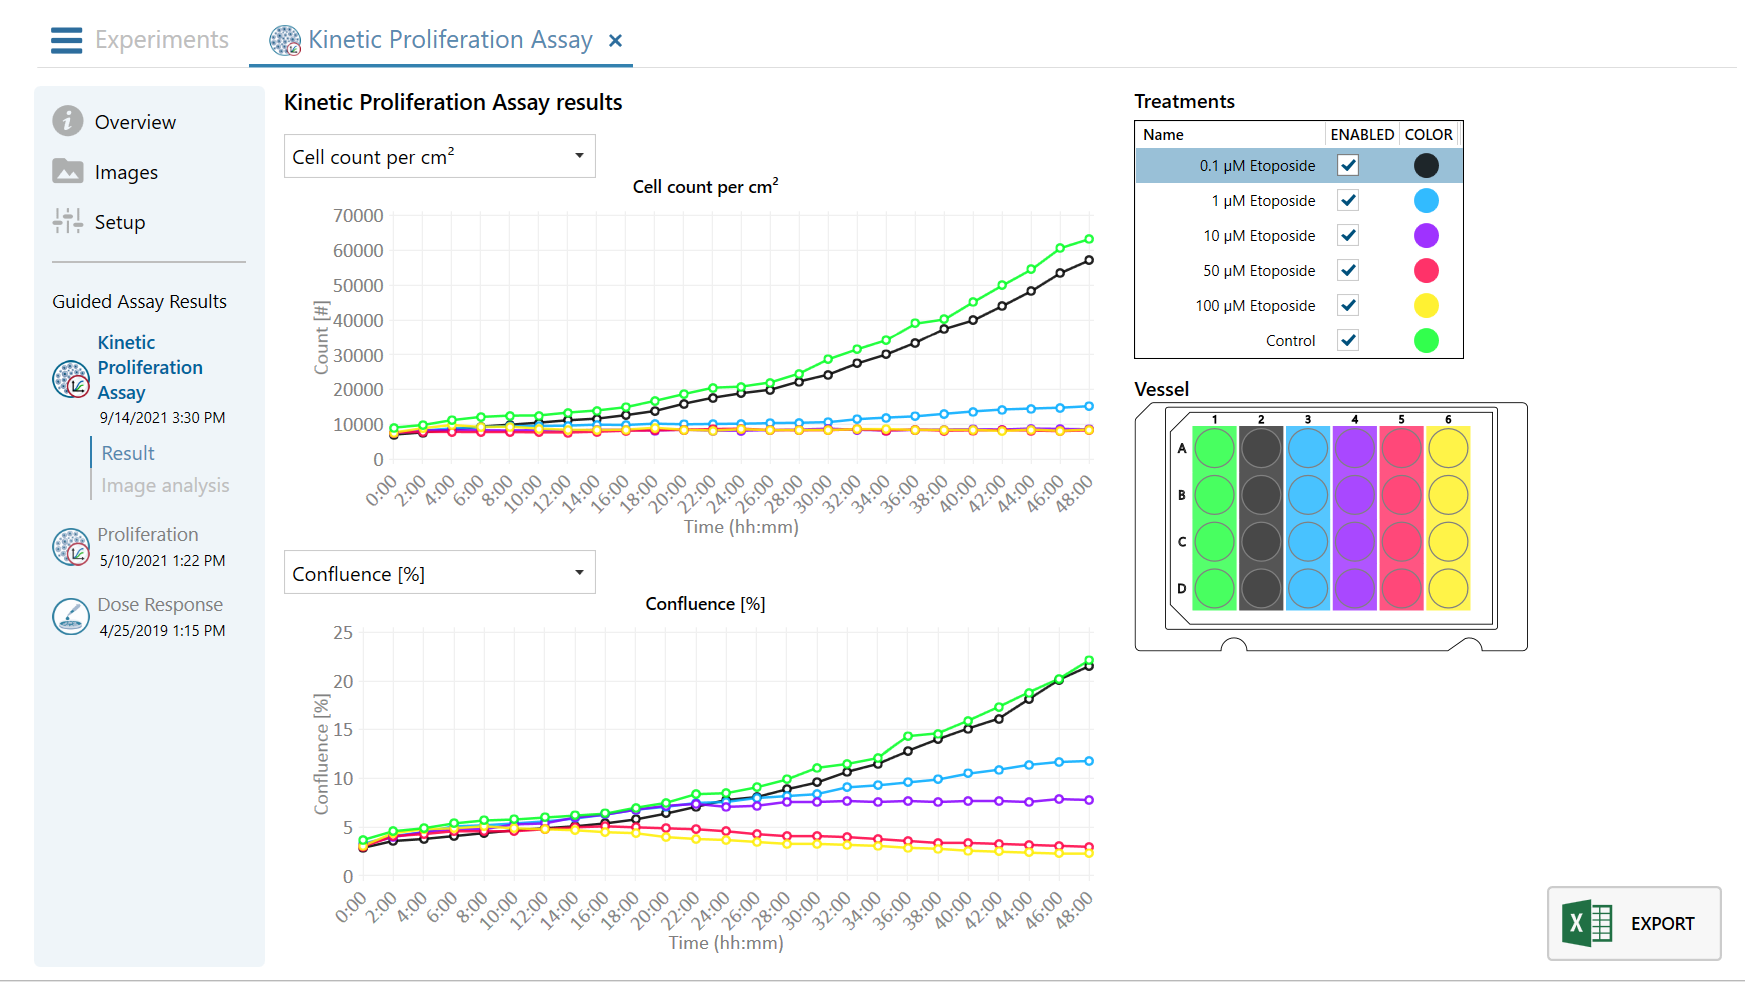
Cell Population Data on Single-cell Level
Obtaining cell population data, including morphology, movement, and growth rate without cellular labels, is ideal, but bright-field microscopy systems struggle to deliver accurate results. Unlike traditional methods that generate images for human visual interpretation, HoloMonitor utilizes advanced QPI technology with digital holography, which produces images primarily for computer analysis. This crucial difference enables the App Suite software to evaluate critical cell population features at a single-cell level automatically.
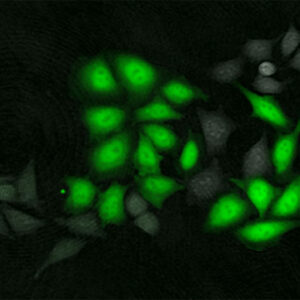
Additional Cell Insights with Fluorescence
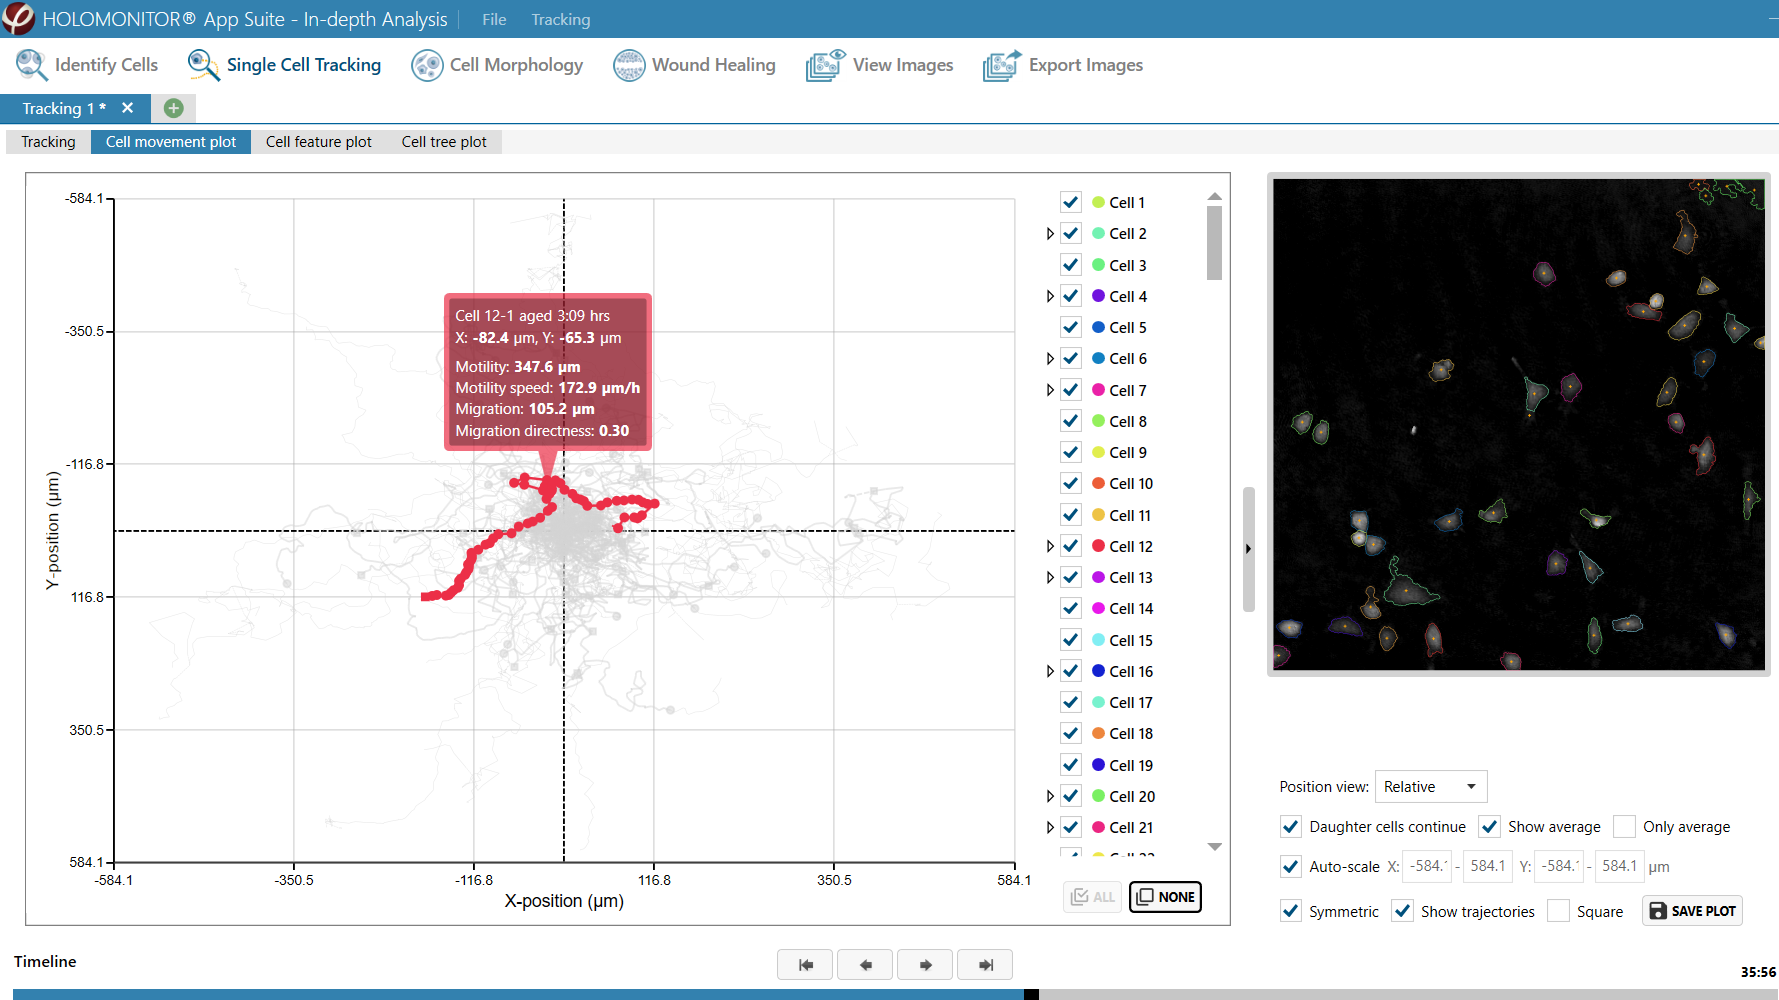
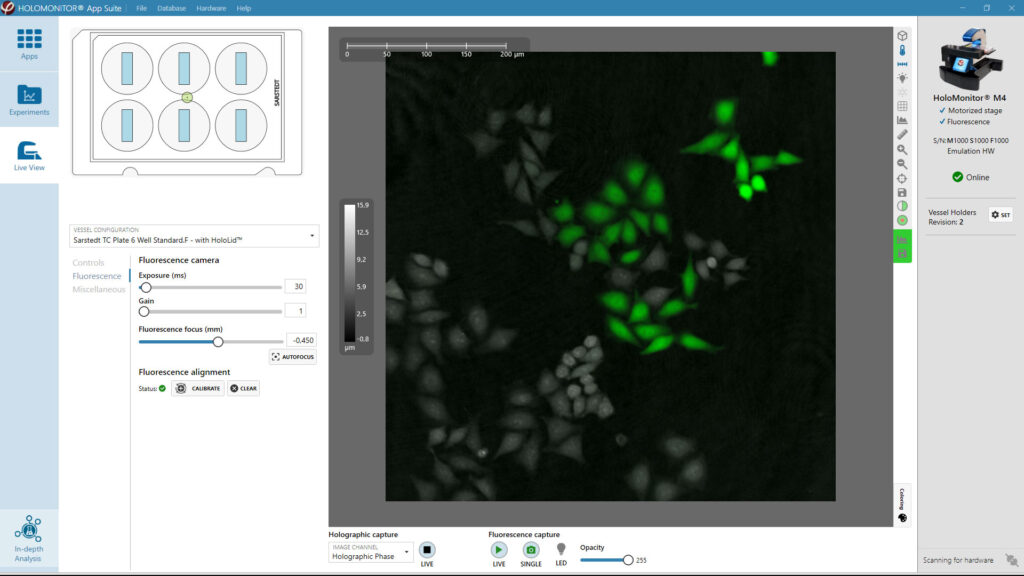
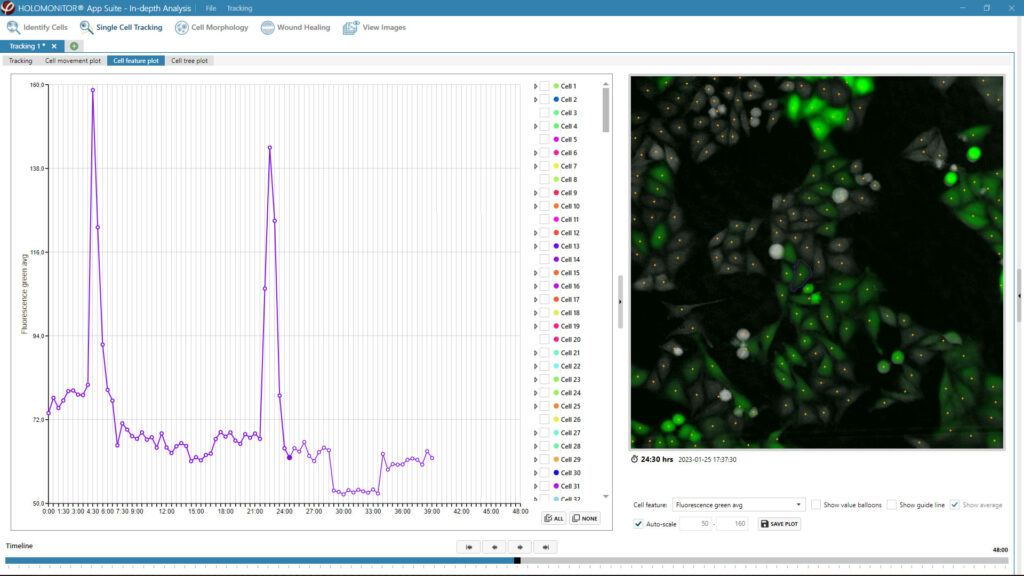
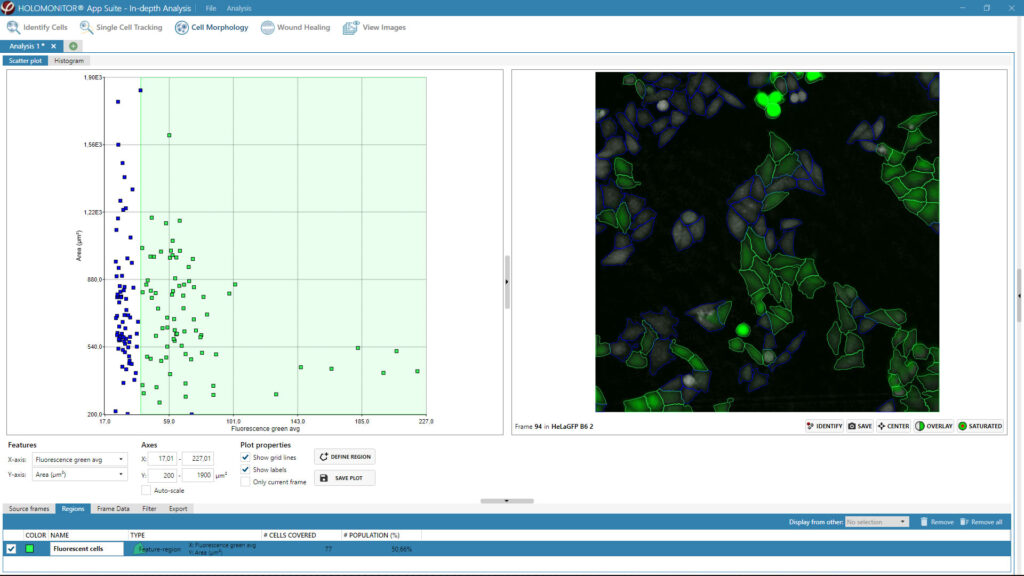
The latest HoloMonitor add-on fluorescence unit allows adding a green fluorescence dimension to the label-free holography data and studying your cells’ behavior in even more detail. You can analyze your cells’ fluorescence signal in HoloMonitor’s Single Cell Tracking and Cell Morphology Assay.
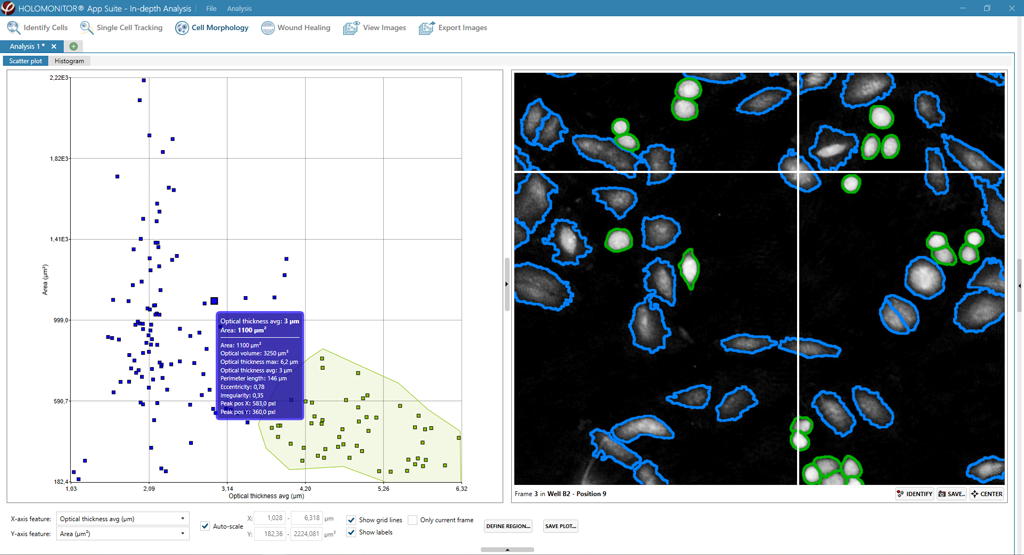
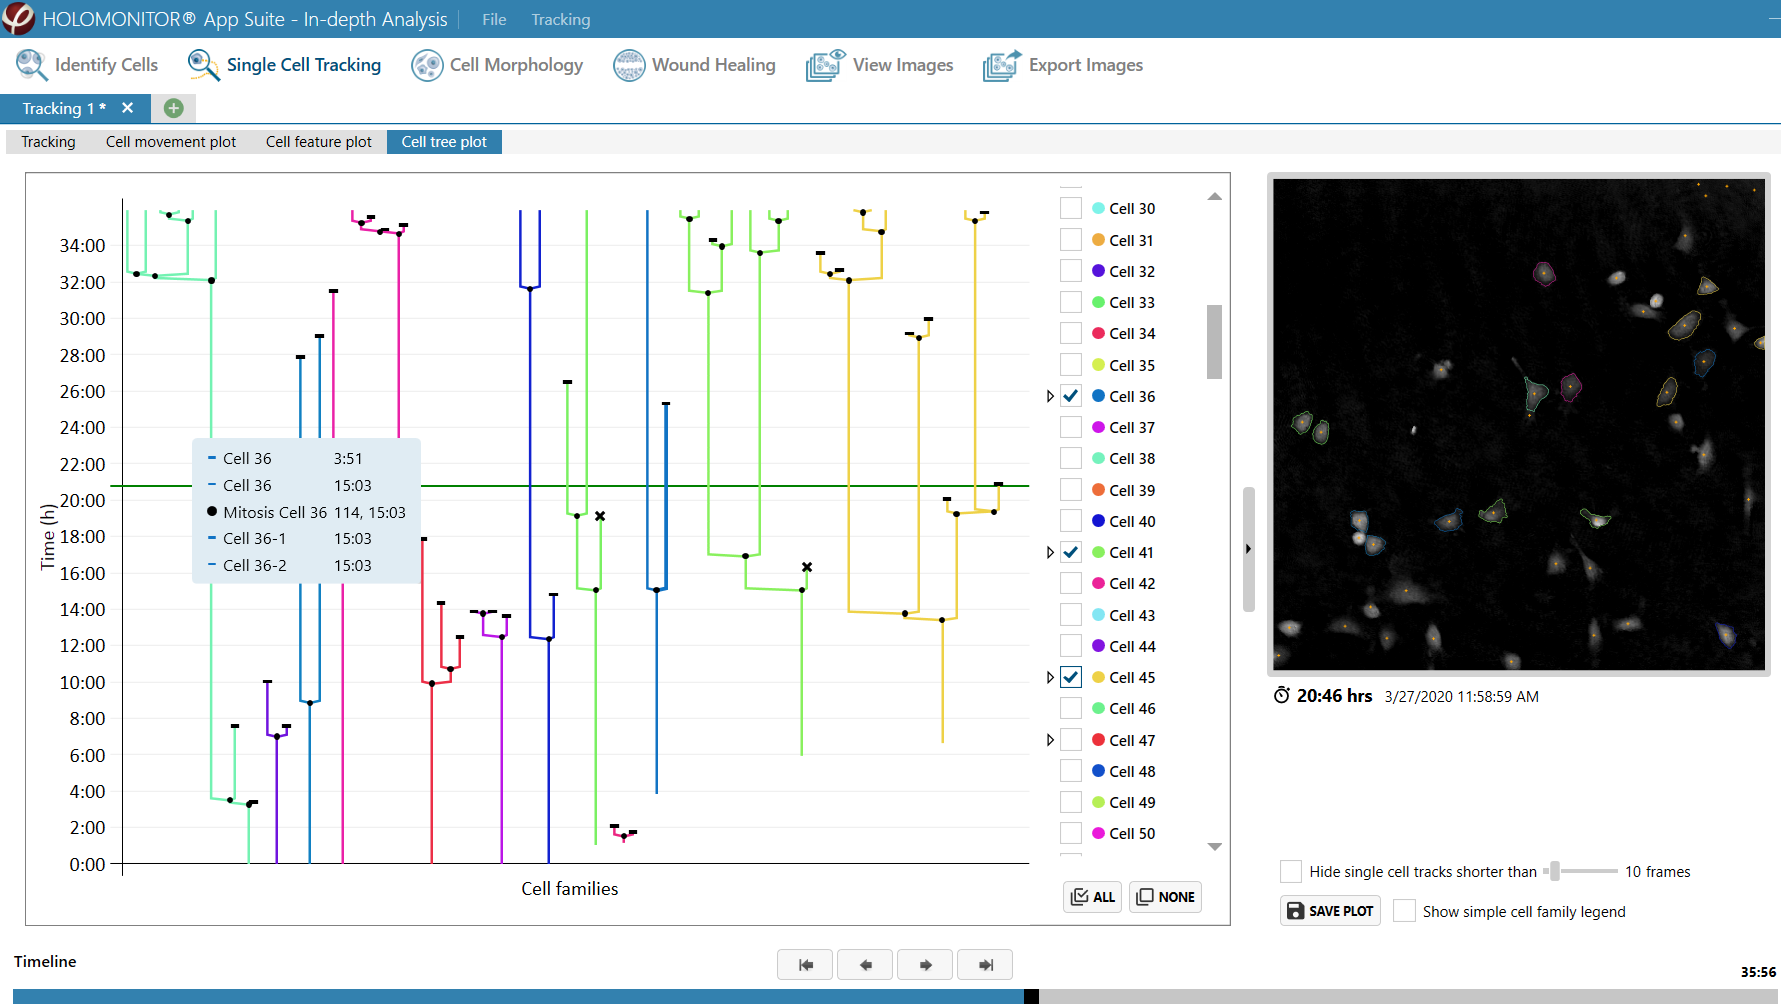
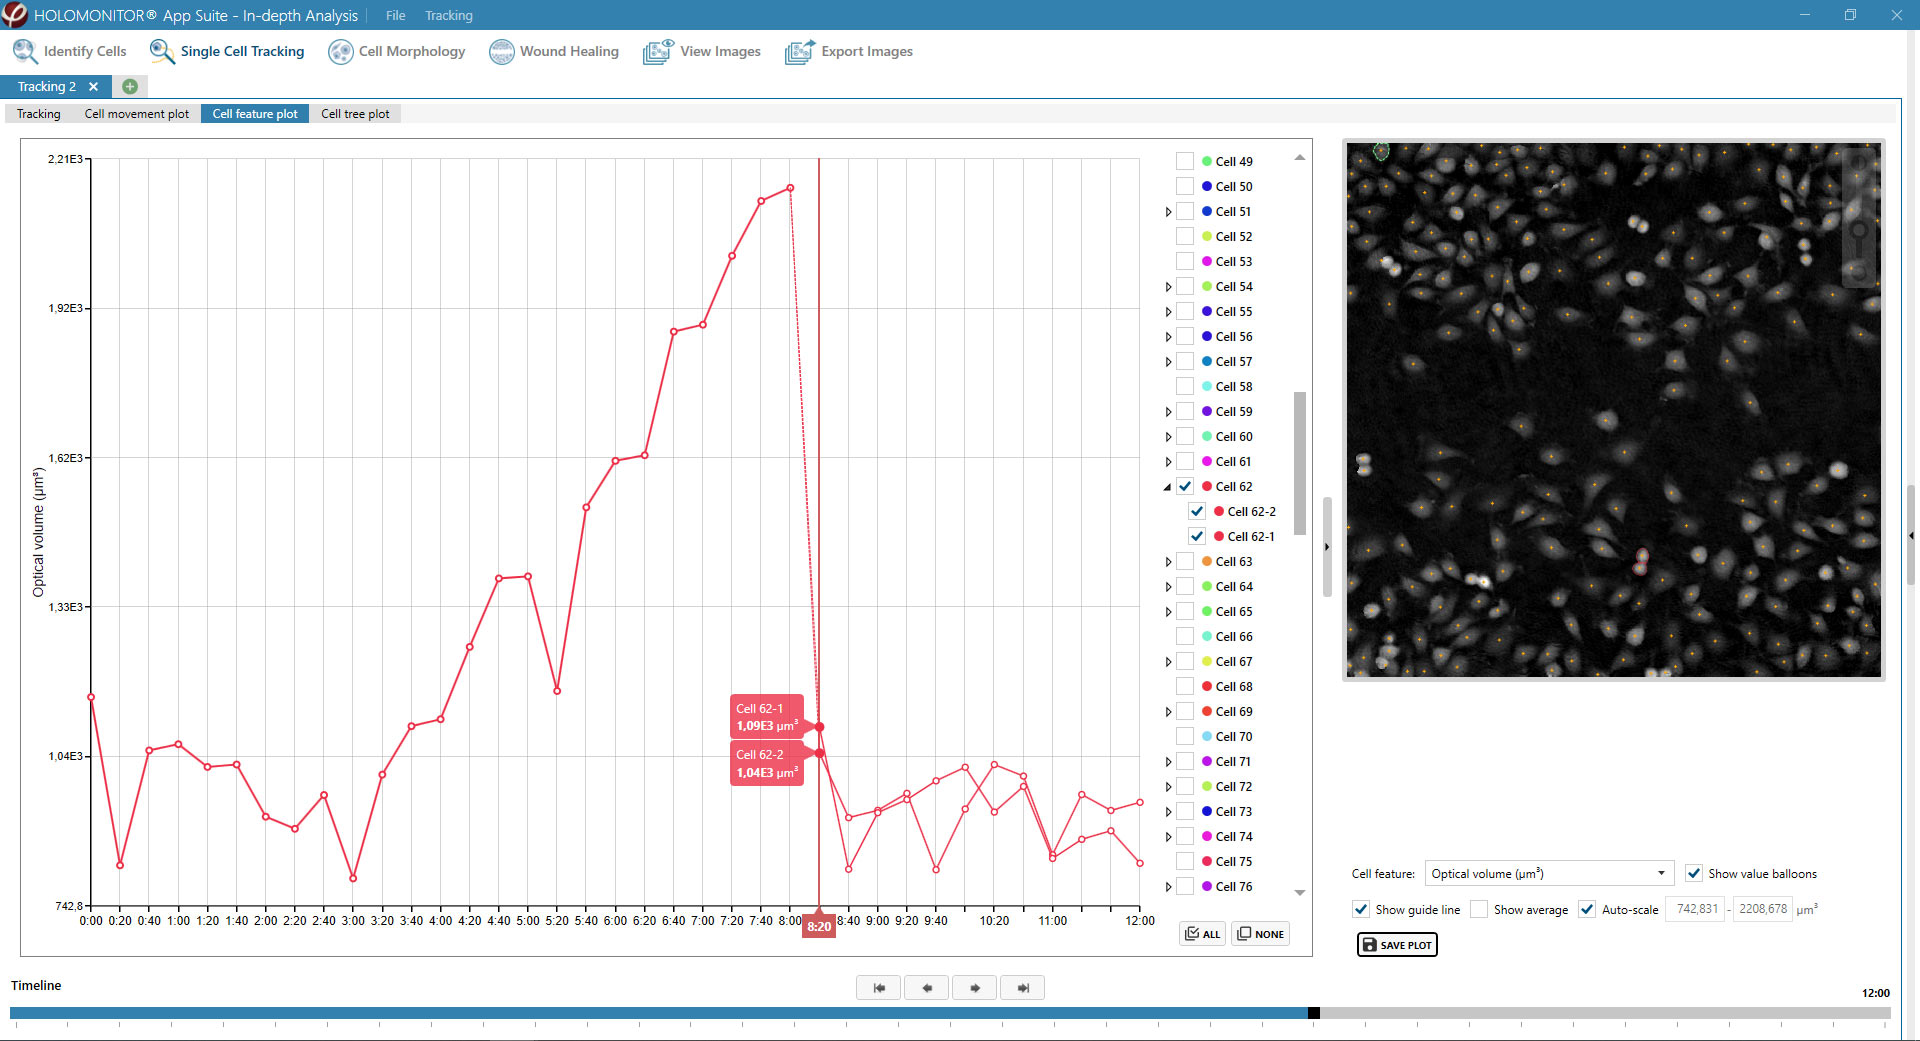
Examples from the Cell Analysis Software:
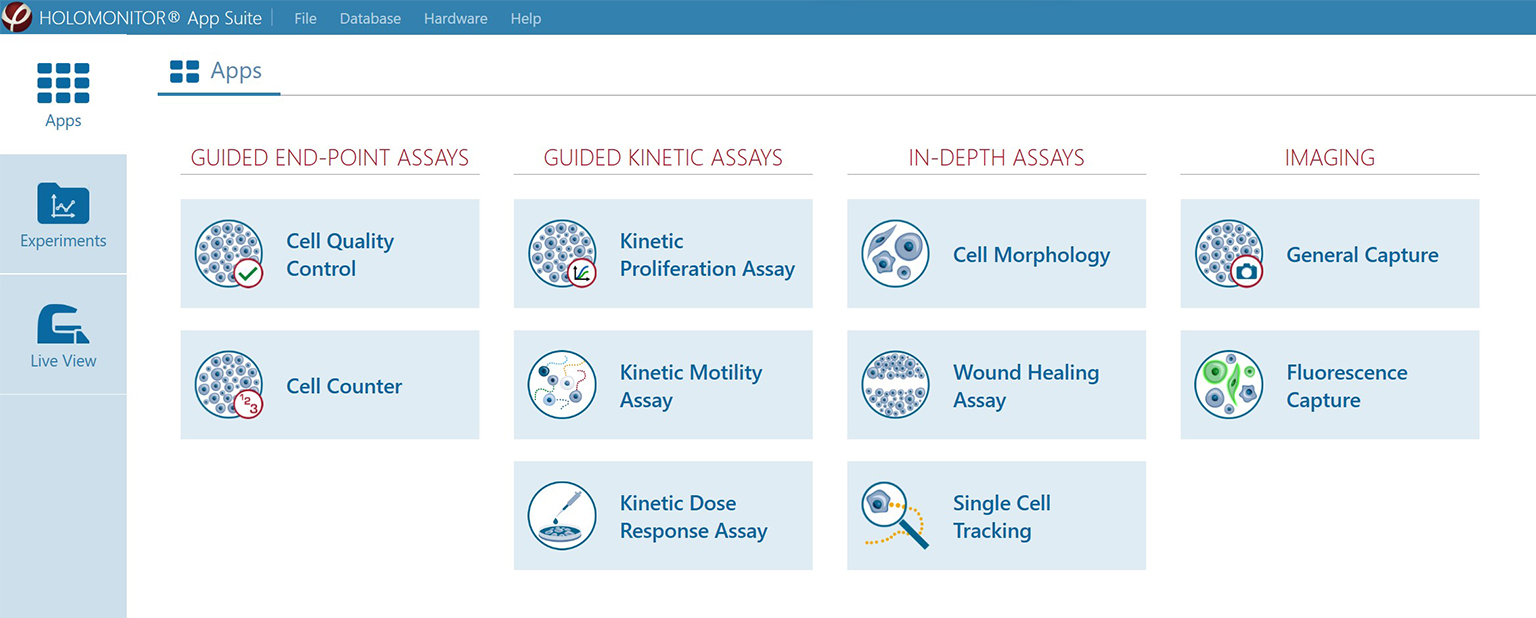
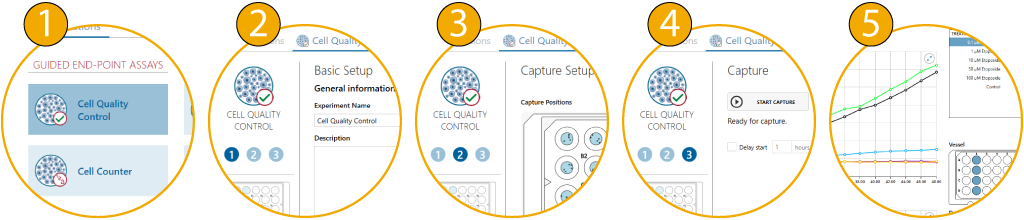
A guided 5-step Workflow
The App Suite software features a simple 5-step user interface:
| 1. | Select Assay | Choose your cell imaging assay. |
| 2. | Sample Setup | Set your experimental conditions. |
| 3. | Imaging Setup | Set your experiment duration and frequency of imaging. |
| 4. | Capture Images | Start your automatic time-lapse imaging. |
| 5. | Real-time Results | View your data evolve during the experiment. |
| 6. | Additional Options | Export cell videos and single-cell data to Excel for further analysis or reanalyze your results with other HoloMonitor live cell assays. |
App Suite in 1 Minute
One Sample — Multiple Assay Results

You can at any time reanalyze the recorded time-lapse images using any one of the HoloMonitor live cell assays. In that way, you can obtain multiple results from the same cell sample and experiment — saving you time, money and, not least, your precious cells.

Moreover, HoloMonitor imaging with label-free holography leaves the cells as they are. This non-invasive QPI imaging technology does not affect the sample so you can use it for further analysis with complementary instrumentation.
Download HoloMonitor App Suite Software
Here you can download the latest version of the HoloMonitor App Suite software. It includes all available assays but requires a license key to become activated. Contact us to get a license quote for the assays you need.
App Suite version: 4.0.2
Required OS: Windows 10 or Windows 11 (64-bit)
Download size: approx. 500 MB
Are you still using Hstudio?
Contact us today for information on upgrading to the latest version of App Suite, the current software for the HoloMonitor system.
HoloMonitor App Suite Release Notes
Database
- We have upgraded the database used by App Suite for storing experiments. Old databases will need to be updated before they can be used. A prompt will request the user to do this upon opening App Suite the first time.
- The databases can be updated in the “My Databases” window.
- This change does not affect new users.
Need help updating your database?
We’ve prepared a short how-to video to guide you through the process.
Cell Morphology
- Added possibility to export cell images, both for the whole frame and individual cells.
General
- We fixed a bug that could make LiveView and CaptureSetup interface lock when capturing fluorescence and moving the stage at the same time.
- Fix to Fluorescence Emulator that caused inconsistent fluorescence calibration.
- We added the possibility to calibrate the Rotation during the assembly of the FL module and M4.
- Instrument Settings files are now backed up on the local computer.
- Stage calibration has changed name to Hardware tool.
- More information added to App Suite log.
New major features
Fluorescence
App Suite now supports fluorescence capture and analysis. This includes functionality for fluorescence module calibration, setting up experiments using both holography and fluorescence as well as added fluorescence support in Cell Morphology and Single Cell Tracking.
Advanced image analysis
Some of the more advanced image analysis features, such as adjusting object size and threshold, have moved into our Guided assays.
New hardware tool
The Stage Calibration tool has turned into a more general Hardware Tool and has received a new graphical look as well as more sections and functionality for hardware diagnosis, service, and calibration. However, the only functionality relevant and fully accessible to most users is still Stage Calibration.
Other features
Database handling
- Added functionality for attempting to repair a database in some specific situations.
- Added database validation warning to clarify for users what needs to be corrected.
- Special characters are now handled when creating a new database.
Wound Healing
- Wound Healing frames are now sorted correctly, leading to correct analyses no matter which order the frames were added.
Cell morphology
- Cell morphology has gotten a new tab with region-specific frame data.
- Added CSV export
- Added cell image export, which exports images of both the whole frame and individual cells, as well as mask images.
Capture setup
- Added Preview result button for quick access to analyses while capture is running.
- New version of laser Calibration
- The capture position coordinate system is now the same as when controlling the stage x, y and z positions.
- Max no. batches have been increased from 10000 to 30000.
Experiments & results
- Experiments list can now be sorted and filtered by database.
- Experiments list now shows the full database path if hovering over the database name with the mouse.
- In Images, all frames are now shown in 2D and without lighting effects by default.
- In Images, it is now possible to automatically loop the timelapse playback.
- Experiment info in Results list and Experiment overview can now be copied to the clipboard.
- Movie export has received a make-over.
- Image export of plain images now supports 16-bit Tiff.
- An experiment that has been manually paused will now have a small note about that in the Experiment description.
- The handling of missing custom vessel maps has been improved.
Identify cells
- Object size minimum value changed from 8 to 3 to allow for analyzing smaller objects.
Single cell tracking
- Some fixes to the Cell tree in Excel export.
Live View
- Added possibility to mirror the camera channel image.
- Camera channel is now always mirrored to fit the holographic channel.
- Measurement tool now works for all channels.
General
- Added support for Ibidi Chemotaxis µ-slide
- The Hardware pane now shows the serial numbers for both M4, stage and fluorescence unit for the connected instrument.
- All wells are now sorted correctly, that is alpha-numerically.
- The App Suite diagnostics log contains even more information for diagnosis.
- We now display the estimated time left for some operations that might take a long time.
- Minor improvements to the user interface and experience throughout App Suite.
- Several bug fixes.
Bug fixes
- Laser Calibration: We fixed an issue that could cause the calibrated values to not be stored properly after re-starting App Suite. This bug was introduced in 3.5.1.
New functionality
In-Depth – Identify cells
- We have decreased the minimum allowed value for Object size to enable segmenting of very small cells or large viruses.
Bug fixes
- Experiment capture: We fixed an issue that could cause the software to crash or the experiment to stall while running an experiment. This bug was introduced in 3.5.0.
New functionality
In-Depth – Wound healing
- The export has been upgraded to the xlsx-format including adding colors, styling and filters to all sheets.
- Graphs showing ‘Gap width (µm)’ and ‘Coverage area (%)’ has been added both the Wound Healing app and the Excel export.
- Analysis settings can now be applied to more than one frame at a time.
- Default vessel pattern is changed to ibidi’s vessel.
In-Depth – Cell Morphology
- A major overhaul of the export has been made, including:
- Upgrading the export to the xlsx-format including adding colors, styling and filters to all sheets.
- Adding/removing/re-organizing data to make it more user-friendly.
In-Depth – Single Cell Tracking
- Included/excluded status, color and cell family number of tracked cells is now saved with the analysis.
In-Depth – General
- A slider to improve contrast in the images has been added to the Image view in Cell Morphology, Wound Healing and Identify Cells.
Live View
- Perspective parameters are added to the Frame view in the Images tab.
- Image analysis and Include/Exclude changes to any wells/position/frames now apply to all Controls that share the same well(s).
Image Viewer
- We have added controls to only include a subset of frames when exporting video and images.
General
- We have tested and confirmed that App Suite 3.5 is Windows 11 compatible.
- We have made a major overhaul of how treatment colors are shown in all exports.
- We have added the possibility to move the stage to the stage removal position from App Suite.
Bug fixes
- Motility export: Added a fix to avoid x-axes in the graphs sometimes being compressed.
- In-Depth General: Fixed sorting of Groups, e.g. to make 2 come before 10 etc.
- Image Capturing: Fixed an issue that happened for some high-end computers that uses a dedicated graphics
card, where the captured frame had pixels with unnaturally high intensities along the top border. - Single cell tracking: Cell family tree graph did not display correctly for computers setup to use a 12-hour time
setting. This is now fixed. - Single cell tracking: Fixed an error during export which made the export fail when more than 400 cell families
was exported. - Experiment summary: Fixed an issue that made the experiment storage size sometimes show a too large value.
Computer Requirements
- Operating system: Windows 10 or Windows 11, 64–bit
- Processor: Intel Core i7 (8th Gen)
- Memory: 16 GB RAM (min 8 GB)
- Storage: 512 GB SSD (min 256 GB)
- Display: Full HD (min 1920×1080)
- Other: 2 built-in USB ports