Year-end report 2024/25
Phase Holographic Imaging PHI AB (publ)
Lund, June 26, 2025
February 2025 – April 2025
| Net sales | 5 580 (1 686) KSEK |
| Operating result before depreciation (EBITDA) | -3 562 (-2 719) KSEK |
| Net result | -5 240 (-5 349) KSEK |
| Earnings per share | -0,08 (-0,22) SEK |
| Gross margin | 79 (60) % |
MAY 2024 – APRIL 2025
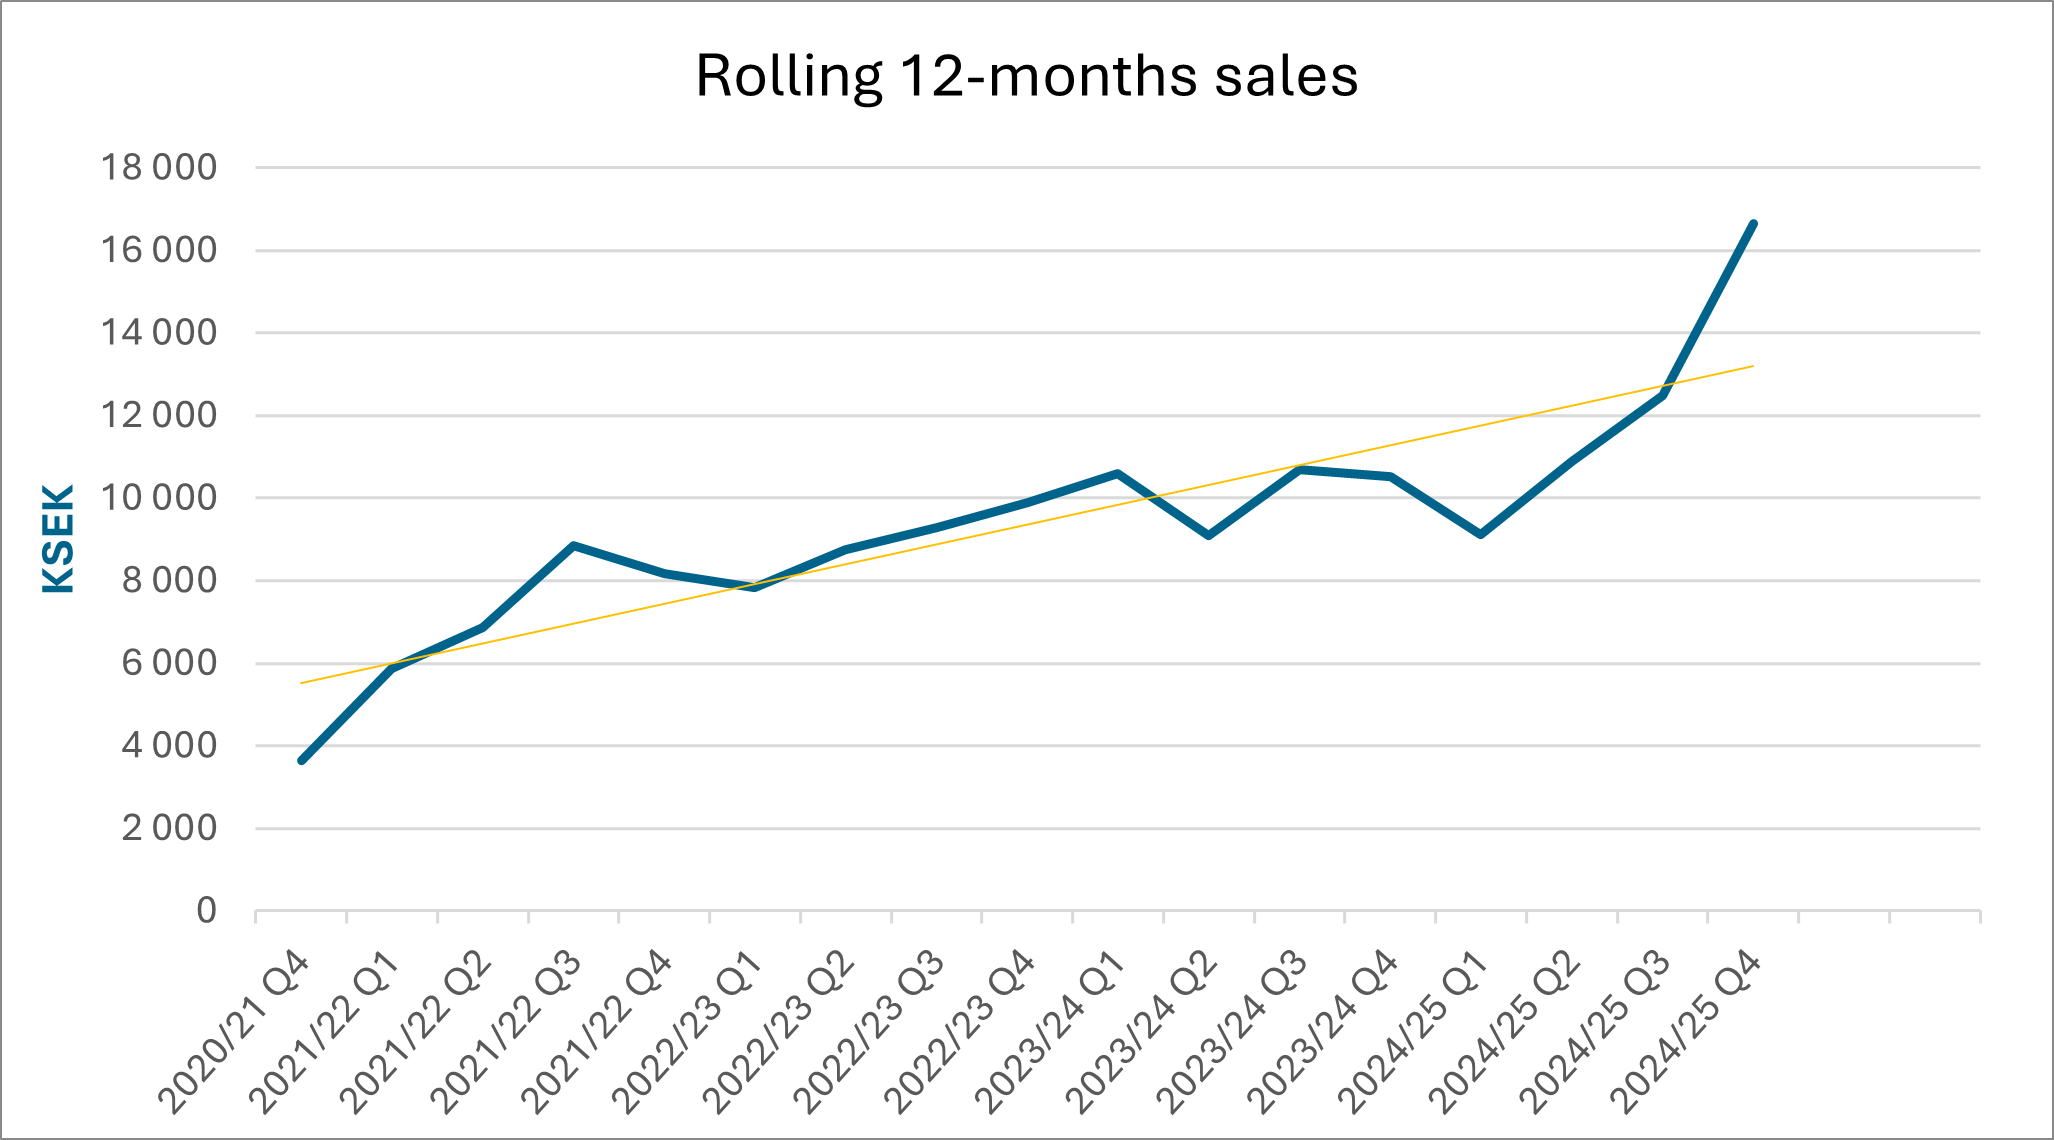
| Net sales | 16 646 (10 510) KSEK |
| Operating result before depreciation (EBITDA) | -12 071 (-13 443) KSEK |
| Net result | -17 519 (-20 175) KSEK |
| Earnings per share | -0,40 (-0,81) SEK |
| Gross margin | 74 (71) % |
In Short
- Sales grew significantly for Q4 and outperformed the FY results of the previous year.
- Gross margin continues to be strong.
- During the period Anders Månsson left as CEO
CEO Commentary
It is with great humility and renewed enthusiasm that I return to lead PHI as its CEO. Having served previously in this capacity, I rejoin the Company at a pivotal time – not only in our journey as innovators in non-invasive live cell imaging but also in our transition toward becoming a central player in the emerging field of regenerative medicine and cell-based therapies.
The fiscal year 2024/2025 has been transformative for PHI. While the year began with a heightened focus on operational streamlining and cost discipline, it evolved into one of the most strategically significant periods in our Company’s history. Central to this evolution was the successful completion of a fully subscribed rights issue, securing approximately SEK 64.3 million. The substantial increase in ownership by our long-term partner, Altium SA, underscored their continued confidence in PHI’s potential and has provided us with the financial strength necessary to implement our roadmap.
During the year, we made significant progress with our new generation product – the HoloMonitor® CellSync system. This innovative platform is currently in pre-production testing at prestigious institutions, including the Huntsman Cancer Institute and the Wake Forest Institute for Regenerative Medicine. These collaborations are not only a testament to the robustness of our technology but also a window into its future applications – particularly in quality control for advanced cell therapies.
Our dual listing on Sweden’s Spotlight Stock Market and the U.S.-based OTCQB Venture Market has also broadened our visibility and access to international capital. These initiatives are crucial as we transition from a research-oriented technology provider to a globally recognized partner in both preclinical and clinical cell research.
I have always believed in the unique value PHI delivers to life science research and its potential impact on global healthcare. Witnessing the strategic groundwork being laid – particularly around our renewed focus on clinical applications – compelled me to return. I was encouraged by the leadership team, the clarity of our vision, and the resounding support from key stakeholders, including our Board and major shareholders. It became clear to me that the journey PHI is on is one I deeply want to be a part of – and lead.
Looking ahead, PHI is strategically positioned at the intersection of imaging technology and regenerative medicine. As the life sciences sector increasingly shifts toward personalized, cell-based therapies, the need for non-invasive, real-time monitoring tools will only intensify. Our HoloMonitor® platform – built on Quantitative Phase Imaging (QPI) – addresses this exact need, offering a label-free, interference-free method for long-term cell tracking and analysis.
In the upcoming fiscal year, we will focus on four core areas:
- Clinical integration – we aim to deepen our partnerships with clinical research centers and regulatory bodies to validate and certify our systems for use in clinical settings.
- Product innovation – development of the HoloMonitor® CellSync system will continue, along with AI-driven features that improve data interpretation and automation.
- Global reach – with the groundwork laid by our dual listing and increasing global visibility, we will expand our market presence, especially in North America and Asia, where demand for regenerative medicine tools is growing rapidly.
- PHI will extend to new markets as well as taking back responsibility for sales and marketing globally.
To our dedicated employees, partners, shareholders, and customers – thank you for your unwavering belief in PHI’s mission. This past year has reminded us of the resilience and ingenuity within our company. As I take the helm once again, I do so with a clear purpose: to build a sustainable, impactful, and globally respected company that transforms how scientists and clinicians interact with living cells.
Let us continue shaping the future of medicine – together.
Have a good summer,

About PHI
About PHI
Phase Holographic Imaging (PHI) is a med-tech company that develops and markets its non-invasive, time-lapse imaging instruments for long-term quantitative analysis of living cells. The foundation of PHI’s current commercial HoloMonitor® products is Quantitative Phase Imaging (QPI) — a technology that heralds an innovative approach to cell quality evaluation. It offers a detailed analysis of cell characteristics without harming the cells, avoiding the limitations of traditional measurement methods. PHI is actively focusing on business development to expand from pre-clinical research to the clinical market and the emerging regenerative medicine field. PHI envisions transforming live cell analysis and establishing QPI as a standard for cell quality control, making our future cell therapies safe, affordable, and accessible for patients. PHI is based in Lund, Sweden, Boston, MA and Winston-Salem, NC.
Quantitative Phase Imaging
Phase Holographic Imaging (PHI), a leading medical technology company, develops and markets its non-invasive time-lapse imaging instruments for studying living cells.
The foundation of PHI’s current commercial HoloMonitor® products is Quantitative Phase Imaging (QPI) technology. This technology brings an innovative approach to real-time cell quality evaluation. It offers a detailed analysis of a large number of cell health and behavior characteristics without harming or influencing living cells and thus differing from conventional measurement methods, which often jeopardize cell integrity.
The QPI miracle: The size and shape of cells provide cell biologists with valuable information on cell health and quality. As nearly all cell types are transparent, automated assessment of their morphology has been very challenging in the past. Unlike any other microscopy technology on the market, QPI acquires a hologram (left). By using sophisticated computer algorithms and mathematics, QPI transforms the hologram into an image where the morphology of each cell is robustly measured (right).
The addressable market
PHI has been active within the pre-clinical and biomedical cell research market, having established a global presence with HoloMonitor® systems and their scientific validation in both academia and industry, primarily addressing cancer, stem cell and drug development research.
PHI’s HoloMonitor technology is transforming pre-clinical research by providing a foundation for better cell models, which are critical before clinical drug testing. This innovative approach, utilizing Quantitative Phase Imaging (QPI), ensures cells remain unaffected during analysis. Unlike conventional cell measurement methods that often require genetic manipulation or staining with toxic substances, QPI offers a non-invasive alternative that maintains the integrity of cell cultures. This advancement addresses the critical need for accurate, cost-efficient pre-clinical data to reduce the high failure rates in drug development. With 9 out of 10 drugs failing in clinical trials due to ineffective results or adverse effects, largely stemming from flawed pre-clinical outcomes, PHI’s technology represents a significant leap forward. By enabling scientists to obtain better data without compromising cell health, HoloMonitor sets a new standard in drug development and basic medical research, aiming for more successful patient outcomes and reduced research expenses.
PHI is strategically prepared to extend its reach into the large clinical market and emerging regenerative medicine field, which presents significant growth opportunities. By striving to achieve Good Manufacturing Practice (GMP) standards and create a company quality management system (QMS), PHI aims to penetrate these markets in the future, where its non-invasive cell analysis solutions can offer critical cell quality control assessment.
Regenerative medicine is a groundbreaking field focused on developing methods to regenerate, repair, or replace damaged cells, tissues, or organs. It integrates biology, chemistry, computer science, and engineering to develop treatments for conditions previously thought untreatable. It has already begun to transform healthcare by offering new hope to patients with conditions like cancer, Parkinson’s disease, diabetes, and deafness, displaying its vast potential to improve and save lives around the globe.
Business model & strategy
PHI markets a competitive combination of sophisticated software and quality hardware, constantly evolving its offerings through in-house development in response to changing market needs. The production of the hardware and accessories is strategically outsourced to specialized subcontractors located in Sweden.
PHI’s business model strategically centers around the HoloMonitor portfolio, designed to meet the specific needs of academia and industry research labs. The Company prioritizes direct interactions and live product demonstrations at potential customer facilities, particularly in cell-based research environments. Combined with a digital marketing approach, this sales strategy is essential for demonstrating HoloMonitor’s advantages firsthand, aiming to foster trust and enabling customers to assess its suitability for their unique research needs. The sales process at PHI is designed to align with the detailed and extended decision-making cycles often found within the scientific community. It accounts for the crucial phase of securing grant funding or other financial support for institutions looking to invest in new research equipment. As a result, sales cycles typically span 6 to 12 months.
Achieving future goals
PHI is focusing on achieving important milestones in the coming years, utilizing the potential of its partnerships and collaborations. PHI has a clear focus on expanding its business to the clinical research market and positioning itself in the Regenerative Medicine field.
PHI’s approach to gaining a stronger foothold in the regenerative medicine field, where PHI’s cell quality control technology can meet critical industry needs. PHI is also actively fostering alliances with leading institutions such as the Wake Forest Institute for Regenerative Medicine (WFIRM), renowned for its groundbreaking contributions to translating scientific research into clinical therapies. Collaborating with WFIRM enriches PHI’s initiatives, providing access to an exceptional ecosystem of expertise and innovation. This partnership bolsters PHI’s leadership in regenerative medicine, enabling the ongoing development and application of PHI’s cell quality control technology.
PHI engages in these strategic relationships to fortify the Company’s position as a thought leader in the field, accelerating progress, bolstering market penetration, opening new doors to new business opportunities, and enhancing shareholder value.
Net Sales and Result
Net sales for the fourth quarter amounted to 5 580 (1 686) KSEK. Operating results before depreciation (EBITDA) amounted to -3 562 (-2 719) KSEK for the fourth quarter. The net result for the fourth quarter amounted to -5 240 (-5 349) KSEK.
Investments
The company invested 1 499 (2 110) KSEK in the product, patent, and application development during the fourth quarter.
Financing
Cash, cash equivalents, and unutilized granted credits amounted to 14 509 (810) KSEK by the end of the period. The equity ratio was 87 (15) %.
Risks
The company may be affected by various factors, described in the 2023/24 Annual Report. These factors may individually or jointly increase risks for the operation and result of the company.
Accounting Principles
The accounts are prepared in accordance with the Annual Accounts Act and general advice from the Swedish Accounting Standards Board BFNAR 2012:1 Annual accounts and consolidated accounts (K3).
Review
This interim report has not been subject to review by the company’s auditor.
Statements About the Future
Statements concerning the company’s business environment and the future in this report reflect the board of director’s current view of future events and financial developments. Forward-looking statements only express the judgments and assumptions made by the board of directors on the day of the report. These statements have been carefully assessed. However, it is brought to the reader’s attention that these statements are associated with uncertainty, like all statements about the future.
Calendar
- 26th of September, Interim Report 1 2025/2026
- End of September: Publication of annual report, which will be available in our office in Lund and on www.phiab.com
- Annual meeting on the 16th of October
About PHI
Phase Holographic Imaging (PHI) is a medical technology company that develops and markets its non-invasive, time-lapse imaging instruments for long-term quantitative analysis of living cells. The foundation of PHI’s current commercial HoloMonitor® products is Quantitative Phase Imaging (QPI) — a technology that heralds an innovative approach to cell quality evaluation. It offers a detailed analysis of cell characteristics without harming the cells, avoiding the limitations of traditional measurement methods. PHI is actively focusing on business development to expand from pre-clinical research to the clinical market and the emerging regenerative medicine field. PHI envisions transforming live cell analysis and establishing QPI as a standard for cell quality control, making our future cell therapies safe, affordable, and accessible for patients. PHI is based in Lund, Sweden, Boston, MA and Winston-Salem, NC.
On behalf of the Board of Directors
Patrik Eschricht, CEO
For additional information, please contact:
Patrik Eschricht
Tel: +46 702 69 99 61
E-mail: ir@phiab.com
Web: www.phiab.com
Consolidated – PHI Group
Income statement (KSEK)
| Q4 | Q4 | FY | FY | |
| 2024/25 | 2023/24 | 2024/25 | 2023/24 | |
| Net sales | 5 850 | 1 686 | 16 646 | 10 510 |
| Cost of products sold | -1 253 | -681 | -4 409 | -3 071 |
| Gross profit | 4 597 | 1 005 | 12 237 | 7 439 |
| Gross margin | 79% | 60% | 74% | 71% |
| Selling expenses | -2 307 | -2 655 | -9 104 | -10 898 |
| Administrative expenses | -4 577 | -2 551 | -10 870 | -5 930 |
| R&D expenses | -2 987 | -1 310 | -7 215 | -7 554 |
| Operating result (EBIT) | -5 274 | -5 510 | -14 952 | -16 943 |
| Financial net | 33 | 162 | -2 568 | -3 232 |
| Result before tax (EBT) | -5 240 | -5 348 | -17 519 | -20 175 |
| Net Result (EAT) | -5 240 | -5 348 | -17 519 | -20 175 |
Balance sheet (KSEK)
| FY | FY | |
| 2024/25 | 2023/24 | |
| ASSETS | ||
| Non-current assets | ||
| Intangible assets | 30 345 | 25 565 |
| Tangible assets | 1 048 | 1 011 |
| Financial assets | 132 | 153 |
| Total non-current assets | 31 525 | 26 729 |
| Current Assets | ||
| Inventory | 2 640 | 3 732 |
| Short-term receivables | 7 244 | 2 374 |
| Cash and equivalents | 14 443 | 167 |
| Total current assets | 24 327 | 6 273 |
| Total assets | 55 853 | 33 002 |
| EQUITY AND LIABILITIES | ||
| Equity | 48 738 | 4 988 |
| Financial liabilities | 17 841 | |
| Operating liabilities | 7 115 | 10 173 |
| Total equity and liabilities | 55 853 | 33 002 |
Changes in equity (KSEK)
| FY | FY | |
| 2024/25 | 2023/24 | |
| Opening Balance | 4 988 | 3 728 |
| Equity issues, net | 59 535 | 22 023 |
| Net profit | -17 520 | -20 175 |
| Translation difference | 1 735 | -588 |
| Closing balance | 48 738 | 4 988 |
| Equity ratio | 87 % | 15 % |
Cash flow analysis (KSEK)
| Q4 | Q4 | FY | FY | |
| 2024/25 | 2023/24 | 2024/25 | 2023/24 | |
| Operating activities | ||||
| Net result | -5 241 | -5 349 | -17 520 | -20 175 |
| Depreciation | 1 712 | 882 | 2 881 | 3 500 |
| Translation difference | 2 462 | -1 070 | 2 241 | -634 |
| Operating cash flow | -1 066 | -5 537 | -12 397 | -17 309 |
| Increase (-)/decrease (+) in inventories | -647 | 1 020 | 983 | 114 |
| Increase (-)/decrease (+) in operating receivables | -4 367 | 3 135 | -4 899 | 2 919 |
| Increase (+)/decrease (-) in operating liabilities | -801 | 1 175 | -2 295 | -2 483 |
| Change in working capital | -5 815 | 5 330 | -6 211 | 550 |
| Cash flow from operating activities | -6 881 | -207 | -18 608 | -16 759 |
| Investing activities | ||||
| Development expenses | -1 500 | -2 002 | -7 694 | -9 056 |
| Patents | -110 | -110 | ||
| Tangible assets | -322 | -455 | -322 | -601 |
| Financial fixed assets | -153 | -153 | ||
| Cash flow after investments | -8 703 | -2 928 | -26 624 | -26 679 |
| Financing activities | ||||
| Net proceeds from equity issues | 198 | 34 | 59 535 | 22 023 |
| Increase (+)/decrease (-) in borrowings | -1 776 | 1 302 | -18 791 | -2 222 |
| Utilized credits | 195 | 1 737 | 195 | 1 737 |
| Cash flow from financing activities | -1 384 | 3 073 | 40 938 | 21 538 |
| Cash flow for the period | -10 086 | 145 | 14 315 | -5 141 |
| Cash and cash equivalents at the beginning of the period | 24 569 | 21 | 167 | 5 308 |
| Cash and cash equivalents at the end of the period | 14 443 | 167 | 14 443 | 167 |
| Incl. unutilized credits | 14 509 | 429 | 14 509 | 429 |
Data per share
| Q4 | Q4 | FY | FY | |
| 2024/25 | 2023/24 | 2024/25 | 2023/24 | |
| Earnings per Share, SEK | -0,08 | -0,22 | -0,40 | -0,81 |
| Equity per share, SEK | 0,77 | 0,19 | 0,77 | 0,19 |
| Number of Shares, end of period | 63 051 780 | 26 192 925 | 63 051 780 | 26 192 925 |
| Average number of shares | 63 051 780 | 26 192 925 | 44 238 600 | 24 808 150 |
| Share price end of period, SEK | 1,40 | 7,80 | 1,40 | 7.80 |
Parent company
Income statement (KSEK)
| Q4 | Q4 | FY | FY | |
| 2024/25 | 2023/24 | 2024/25 | 2023/24 | |
| Net sales | 5 683 | 1 771 | 16 101 | 9 657 |
| Cost of products sold | -1 255 | -859 | -4 288 | -3 506 |
| Gross profit | 4 428 | 912 | 11 813 | 6 151 |
| Gross margin | 78% | 51% | 73% | 64% |
| Selling expenses | -1 007 | -1 379 | -4 279 | -5 877 |
| Administrative expenses | -4 570 | -2 550 | -10 863 | -5 929 |
| R&D expenses | -2 987 | -1 310 | -7 215 | -7 554 |
| Operating result (EBIT) | -4 135 | -4 327 | -10 544 | -13 209 |
| Financial net | -18 241 | 162 | -20 842 | -3 232 |
| Result before tax (EBT) | -22 376 | -4 165 | -31 386 | -16 441 |
| Net Result (EAT) | -22 376 | -4 165 | -31 386 | -16 441 |
Balance sheet (KSEK)
| FY | FY | |
| 2024/25 | 2023/24 | |
| ASSETS | ||
| Non-current assets | ||
| Intangible assets | 27 600 | 23 986 |
| Tangible assets | 1 048 | 1 011 |
| Financial assets | 25 | 14 003 |
| Total non-current assets | 28 673 | 39 000 |
| Current Assets | ||
| Inventory | 1 871 | 2 734 |
| Short-term receivables | 6 992 | 2 242 |
| Cash and equivalents | 13 777 | 90 |
| Total current assets | 22 640 | 5 066 |
| Total assets | 51 314 | 44 066 |
| EQUITY AND LIABILITIES | ||
| Equity | 44 249 | 16 100 |
| Financial liabilities | 17 841 | |
| Operating liabilities | 7 065 | 10 125 |
| Total equity and liabilities | 51 314 | 44 066 |