
Application Note
Quantitative long-term monitoring of non-adherent cells by digital holographic microscopy
by Cosette J and Stockholm D
EPHE-PSL University, Paris, France
Genethon, Evry, France
Introduction
Time-lapse microscopy is the method of choice for studying the dynamics of cell processes. Non-adherent cells, such as hematopoietic stem cells or lymphocytes, provide challenges for live imaging as they migrate rapidly and are likely to leave the field of view. Special coatings and staining of any type, including living cell labeling, could affect the physiological relevance of the study by somehow activating cells in an uncontrolled way (Gilner et al. 2007). As a way to circumvent these problems, a methodology was developed by Daniel Day (Day et al. 2009) that relies on the use of biocompatible uncoated silicone microgrids containing 60 µm walls. These walls prevent cells from escaping the field of view without restricting cell motility and cell-to-cell interactions.
In this work we show that the dynamic changes of cord-blood derived CD34+ cells in response to cytokine stimulation can be successfully studied, in a label-free way, using digital holographic microscopy. This approach can be easily applied to any type of non-adherent cell monitoring.
Material and Methods
Cell Isolation and Culture
Human umbilical cord blood (UCB) was collected from placentas and/or umbilical cords obtained from Saint Louis Hospital, France in accordance with international ethical principles and French national law (bioethics law n82011–814) under declaration N8DC-201- 1655 to the French Ministry of Research and Higher Studies. Human CD34+ cells were isolated using autoMACS pro (Miltenyi Biotec, France) by immunomagnetic selection based on human CD34 expression within the mononuclear cell fraction of UCB samples. Cells were cryopreserved in Cryostor (StemCell, France) and stored in liquid nitrogen.
Immediately after thawing, cells were put in an activation medium, whose base is X-VIVO medium (Lonza) supplemented with 100 U/ml penicillin, 100 mg/ml streptomycin (Gibco, Thermo Scientific), that contains activation cytokines: 50 ng/ml h-FLT3L, 25 ng/ml h-SCF, 25 ng/ml h-TPO, and 10 ng/ml h-IL3 (Miltenyi Biotec, Paris, France). Cells were cultured and imaged in this medium for the whole study in a humidified 5% CO2 atmosphere at a temperature of 37°C.
Microgrid preparation
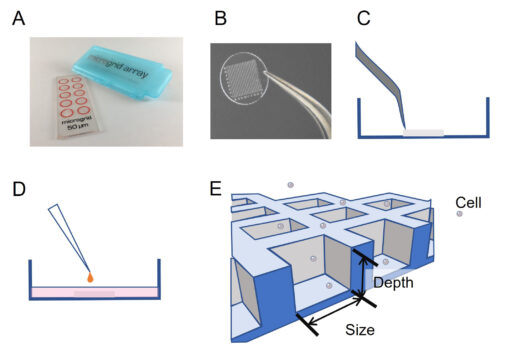
A microgrid array (Microsurfaces, Australia) made of Polydimethylsiloxane (PDMS – biocompatible silicone) containing 1,024 micro-wells (125 μm width, 60 μm depth) was placed in an uncoated 35 mm dish (Ibidi, Germany) with a polymer coverslip bottom (Figure 1). The transfer is operated by peeling the microgrid from its support with a pair of tweezers and depositing it directly on the glass. A volume of 200 µL of EtOH 100% is added onto the microgrid for 5 min to sterilize it and minimize contamination risks during time-lapse imaging. EtOH is then pipetted out and the microgrid is left to be dried 30 min under a hood (http://microsurfaces.com.au/instructions.html). The whole dish was then filled with cell culture medium. Five thousand cells were loaded above the microgrid array and left 10 min for sedimentation. According to Poisson’s law, about 30% of microwells are gifted a single cell.
Time-lapse microscopy
Time-lapse acquisitions were performed with HoloMonitor® M4 – placed inside an incubator (5% CO2 – 37°C). Twenty field positions were recorded covering 4 microwells each. Images were acquired every 10 minutes for 4 days using a 20X objective. Images were processed with HoloMonitor® App Suite software (PHI, Sweden). Data were also exported, and the cell parameters eccentricity and motility were processed with R (R Core Team 2020) for graphics purposes. The parameter eccentricity describes how much the cell deviates from being a circle. A value of 0 corresponds to a circle and the more elongated the cell is the higher the eccentricity value becomes, approaching 1. The motility parameter gives the actual distance traveled by the cell between the starting point and the endpoint of the cell path.
Results
Morphology determination
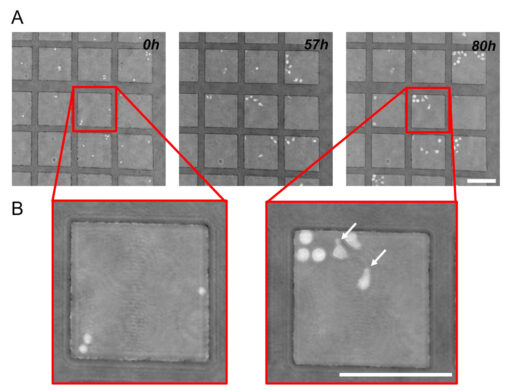
Previous studies have demonstrated that there is a connection between cell morphology and the differentiation potential of CD34+ cells. Two major morphological forms have been described in the CD34+ cord blood cell fraction. Polarized cells with an amoeboid shape are capable of active motion by vigorous shape change and generally possess at one end a large protrusion called uropod. These cells have been found to retain primitive self-renewing and stem cell functions (Gorgens et al. 2014). The second morphological type is round. These cells have been considered as already engaged in differentiation (Wagner et al. 2004).
Images obtained with Holomonitor® M4 revealed that the two cell morphologies previously described can be easily observed. After recovering from the stress of isolation and manipulation, founder cells (i.e. cells that were initially put in the microgrid) acquired polarized morphologies within a few hours, developing uropods and starting a phase of active motion (Figure 2).
Motility and eccentricity quantification
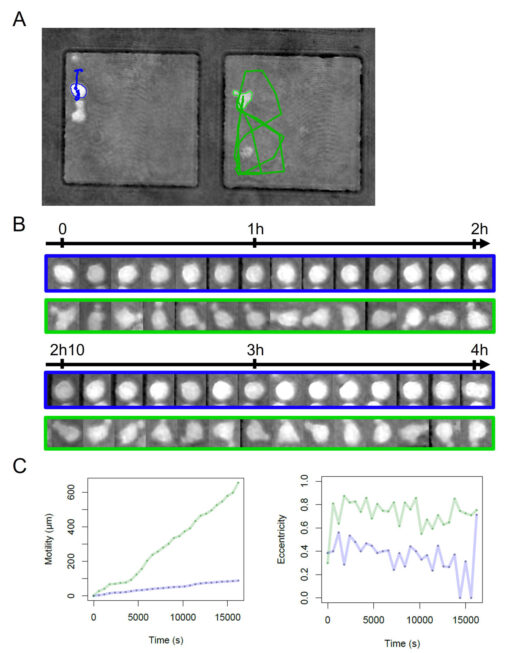
To illustrate the capacity of the system to quantify both the shape and the motility of cells, we explored two parameters that are easily computed with the cell tracking device. We monitored two types of cell behavior which seem to be correlated with the type of cell shape. Polarized cells tend to have strong motility while round cells exhibit low motility. Quantification of the eccentricity is a good means to classify a cell into one of the two categories (polarize vs round). We have shown an example of differences in cell behavior connected to the two categories during monitoring of four hours with a focus on two particular cells (Figure 3). The round cell with an average eccentricity of 0.36 ± 0.15 shows low motility which does not exceed 100 µm with a track restricted to a very small area in the upper corner of the microwell. On the other hand, the polarized cell in the neighboring microwell displays a wide track, covering almost 40% of the well surface area with motility climbing up to 600 µm, while its eccentricity has an average of 0.72 ± 0.12 (Figure 3C).
Growth of the cells during the first 96 hours.
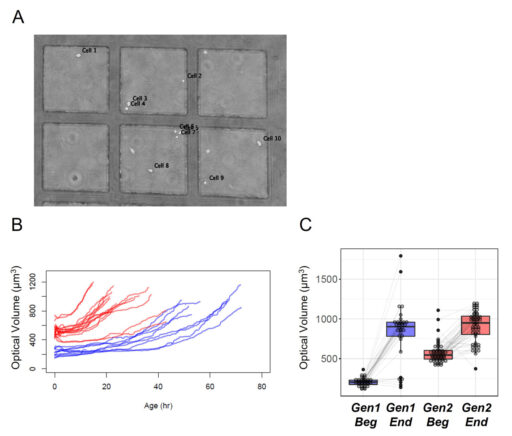
Cell dry mass can be determined by quantitative phase imaging (Barer 1952 and Aknoun et al. 2015). The refractive index of solution was shown to be the sum of the solvent refractive index and an increment proportional to the solute mass density. We applied this technique of measurement to distinguish the cell growth evolution of the first generation compared to the second generation (Figure 4). This approach has the advantage to avoid any modification of the sample.
The results show a clear difference in the aging between the first generation compared to the second generation for which the age of the cells is much shorter than previously described (Moussy et al. 2017 and Cosette et al. 2017). Furthermore, the HoloMonitor® M4 system enables us to quantify the cell dry mass based on optical volume for a significant number of cells, demonstrating that the shorter time for a division is associated with a smaller differential of growth compared to the first generation (Figure 4 C).
Discussion
We show in this report the feasibility to follow, at the single-cell level, cell morphology, cell motility, and cell growth of non-adherent cells during several days thanks to the use of a microgrid array combined with a quantitative phase imaging system.
Holographic microscopy is a label-free approach, therefore avoiding any modification of the sample or any labeling that could change the fate of the cell, especially hematopoietic CD34+ stem cells (Gilner et al. 2007).
The combination of the microgrid array and quantitative phase imaging overcomes the cell motility challenge of time-lapse microscopy of non-adherent cells, which is their very ability to get out of the field of view, or out of focus.
Following changing cell morphology characteristics requires a strong and precise segmentation, which usually remains a challenge for phase-contrast images. On the other hand, digital holographic images contain more information, then enabling a very satisfactory and greatly improved cell segmentation when associated with HoloMonitor® software algorithms.
One of the strong benefits of using the HoloMonitor® M4 compared to standard methods is the ease of quantification of critical parameters like the optical volume which can be directly related to cell growth. It also offers the possibility to capture rare events in subpopulations of cells (e.g. dying cells). The overall advantages of this approach are a substantial gain of time due to the automatic image analysis requiring only a few manual corrections, the accurate estimation of cell dry mass, and the possibility to simultaneously study different conditions.
We show in this report that quantitative phase imaging is compatible with PDMS, paving the way for single-cell-on-chip analysis, for instance on microfluidic chips. Furthermore, the ability we show to monitor motility and trajectory patterns of cells could be of great interest to many fundamental research fields or in the study of diseases in which cell motility plays a key role such as metastatic cancer disease.
References
Aknoun S, Savatier J, Bon P, Galland F, Abdeladim L, Wattellier B, Monneret S. Living cell dry mass measurement using quantitative phase imaging with quadriwave lateral shearing interferometry: an accuracy and sensitivity discussion. J Biomed Opt. 2015; 20(12):126009.
Barer R. Interference Microscopy and Mass Determination. Nature 169, 366–367 (1952). doi: 10.1038/169366b0
Cosette J, Moussy A, Paldi A, Stockholm D. Combination of imaging flow cytometry and time-lapse microscopy for the study of label-free morphology dynamics of hematopoietic cells. Cytometry A. 2017 Mar; 91(3):254-260.
Day D, Pham K, Ludford-Menting MJ, Oliaro J, Izon D, Russell SM, Gu M. A method for prolonged imaging of motile lymphocytes. Immunol Cell Biol. 2009 Feb; 87(2):154-8. doi: 10.1038/icb.2008.79.
Gilner JB, Walton WG, Gush K, Kirby SL. Antibodies to stem cell marker antigens reduce engraftment of hematopoietic stem cells. Stem Cells. 2007; 25:279–288.
Gorgens A, Ludwig AK, Mollmann M, Krawczyk A, Durig J, Hanenberg H, et al. Multipotent hematopoietic progenitors divide asymmetrically to create progenitors of the lymphomyeloid and erythromyeloid lineages. Stem cell reports. 2014; 3(6):1058–72.
Moussy A, Cosette J, Parmentier R, da Silva C, Corre G, Richard A, Gandrillon O, Stockholm D, Páldi A. Integrated time-lapse and single-cell transcription studies highlight the variable and dynamic nature of human hematopoietic cell fate commitment. PLoS Biol. 2017 Jul 27; 15(7):e2001867.
R Core Team (2020). R: A language and environment for statistical computing. R Foundation for Statistical Computing, Vienna, Austria. https://www.R-project.org/.
Wagner W, Ansorge A, Wirkner U, Eckstein V, Schwager C, Blake J, et al. Molecular evidence for stem cell function of the slow-dividing fraction among human hematopoietic progenitor cells by genome-wide analysis. Blood. 2004; 104(3):675–86.