How Can HoloMonitor® Improve Your Cell Cycle Research?
The most common way to study the cell cycle is to use flow cytometry. However, this requires intense sample preparation and often wastes your cells in the end. Hence, there are several benefits to using the HoloMonitor® live cell imaging system in your cell cycle research instead:
- It is completely non-invasive and uses no cytotoxic stains.
- It does not require any sample pre-processing.
- The studied cells are not wasted but can be used further.
- It operates directly inside your regular incubator.
Study cell cycle arrest
G1 cell cycle arrest leads to a population with small cells, while G2 arrest leads to large cells. HoloMonitor can measure these volume changes. This lets you monitor and study cell cycle arrest. In fact, the HoloMonitor accuracy has been shown to be on par with flow cytometry, but without the need to pre-process the cells.
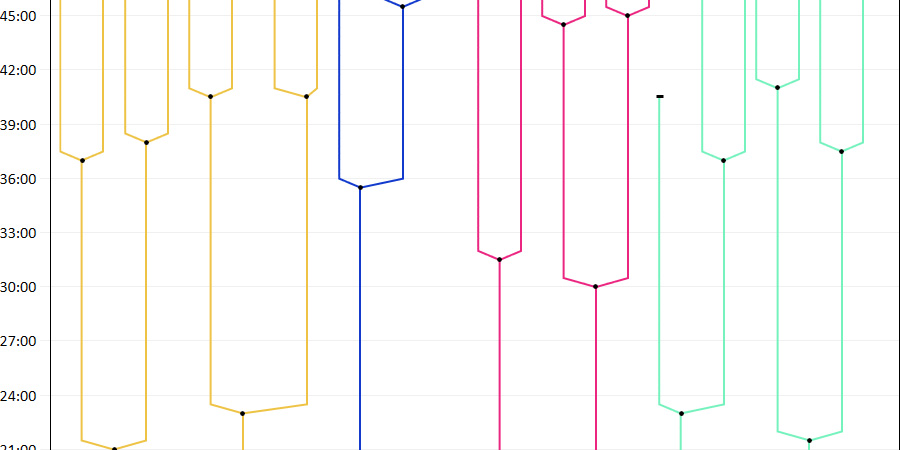
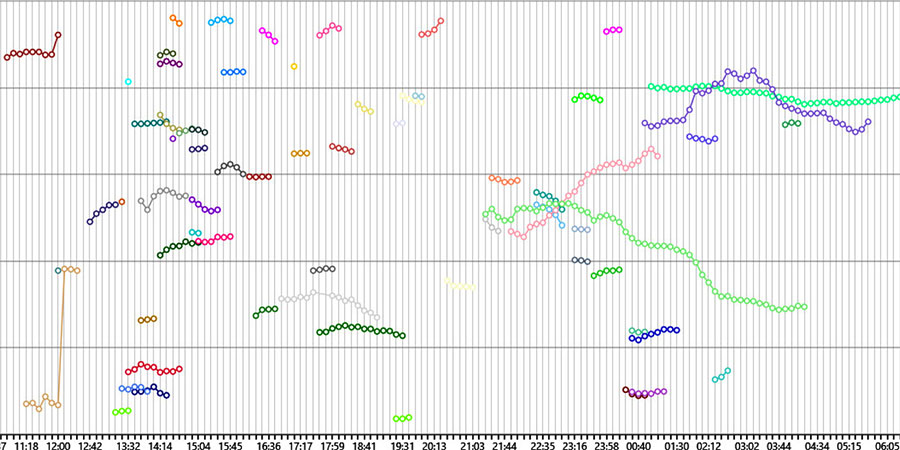
Monitor cell division
HoloMonitor tracks and images all cell divisions in your culture. The data is presented in cell trees. From this, you can get single-cell data on cell cycle time and mitosis time. Of course, you can also merge it into population level data. This gives you the population doubling time and proliferation rate.
Measure mitosis duration
Mitosis duration assays often use fluorescent staining of some sort. However, HoloMonitor lets you study mitosis in a normal cell culture vessel, with no staining at all, inside your incubator. It images your cells at given time points and then gives you relevant data based on the images. After that, you follow a simple protocol to get the mitosis duration for each cell in your culture.
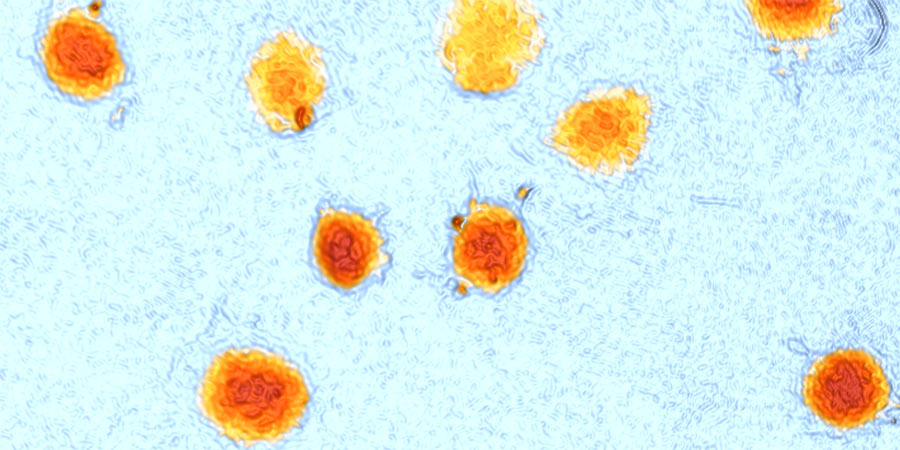
Catch aberrant cell divisions
A normal cell division results in two daughter cells, but on rare occasions, the result is three or more cells. The HoloMonitor Single Cell Tracking assay tracks all cells in real time and detects both normal and aberrant cell divisions. Hence, you can use HoloMonitor to monitor aberrant cell divisions in your culture and study all newly formed daughter cells.
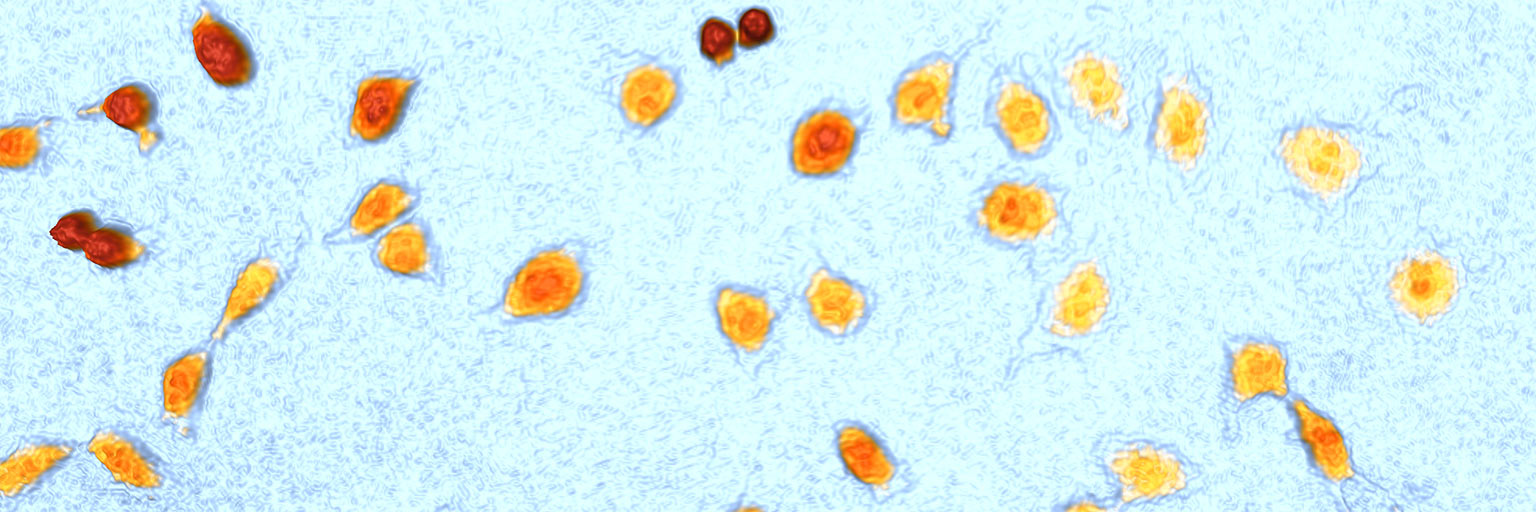
Study cell cycle progression
Throughout the cell cycle, the cell goes through several morphological changes. HoloMonitor measures more than 30 morphological parameters and their variation over time. You can use this data to create a scatter plot and then separate cells based on their cell cycle phase. Hence, you can get the cells’ distribution over G1, S, G2, and M phases. You can also go on and analyze cells in a specific phase further.
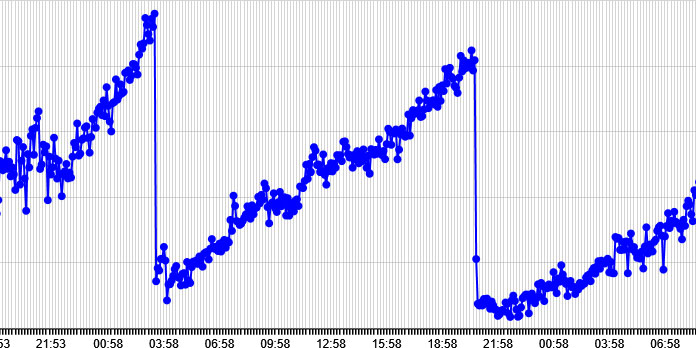
Determine cell cycle length
HoloMonitor measures the cells’ optical thickness over time, and this increases as the cell cycle progress. When it is completed and the cell divides, the optical thickness decreases abruptly. Therefore, by plotting the optical thickness against time, you get a clear graph showing the time between two cell divisions. This is the time it takes for the cell to complete one cell cycle.