Interim Report 2 2023/24
Phase Holographic Imaging PHI AB (publ)
Lund, December 21, 2023
AUGUST 2023 – OCTOBER 2023
| Net sales | 1 225 (2 732) KSEK |
| Operating result before depreciation (EBITDA) | -4 037 (-4 325) KSEK |
| Net result | -5 375 (-5 304) KSEK |
| Earnings per share | -0.23 (-0.26) SEK |
| Gross margin | 71 (59) % |
MAY 2023 – OCTOBER 2023
| Net sales | 3 951 (4 767) KSEK |
| Operating result before depreciation (EBITDA) | -6 389 (-9 173) KSEK |
| Net result | -9 675 (-11 057) KSEK |
| Earnings per share | -0.47 (-0.54) SEK |
| Gross margin | 74 (53) % |
In Short
- This quarter marked a strategic shift in our global sales organization, affecting our Q2 sales.
- Post-Q2, Altium was ratified as a global PHI distributor on November 14, 2023.
- In a multi-day training in Istanbul, over 35 sales representatives were trained on HoloMonitor — a historic number and more than PHI ever had.
- Altium’s intensified support as our largest investor solidifies them as a long-term partner. This is crucial for scaling our pre-clinical sales and focusing on QPI technology development for regenerative medicine.
- Our focus remains on aiming for the clinical market through ongoing GMP efforts, establishing a quality management system, and progressing rapidly at our WFIRM-based PHI development office.
CEO Commentary
Sales
A period of transition
The autumn quarter marked new beginnings and strengthened partnerships for PHI. Due to our strategic shift, we had to terminate some distributors and, at the same time, wait for the approval of the extraordinary shareholders meeting on November 14 to initiate our major shareholder, Altium, as our new global distribution partner. Unfortunately, the timing was inconvenient and impacted our Q2 sales this year, but we believe in the long-term success of this sales organization shift.
I see a trusted long-term partner in Altium who enriches us with a vast network and industry expertise, which are key to expanding our market footprint. Their commitment to opening new markets and the right to subcontract distributors directly is a testament to the strength of our collaboration.
The strategic shift of our sales to Altium’s network enables our team to concentrate on what we do best: innovating with QPI technology, particularly focusing on product development for regenerative medicine. We envision that Altium’s infrastructure and connections will elevate our HoloMonitor product line across various markets and support our development toward positive cash flow and financial sustainability.
Business Development
Advancing regenerative medicine
Our goal is clear: make QPI the gold standard in cell therapy quality control, advancing regenerative medicine to be safe, accessible, and affordable for patients. Our integral role at the Wake Forest Institute for Regenerative Medicine (WFIRM) highlights this commitment.
WFIRM’s physicians and scientists were the first in the world to engineer laboratory-grown organs that were successfully implanted into humans.
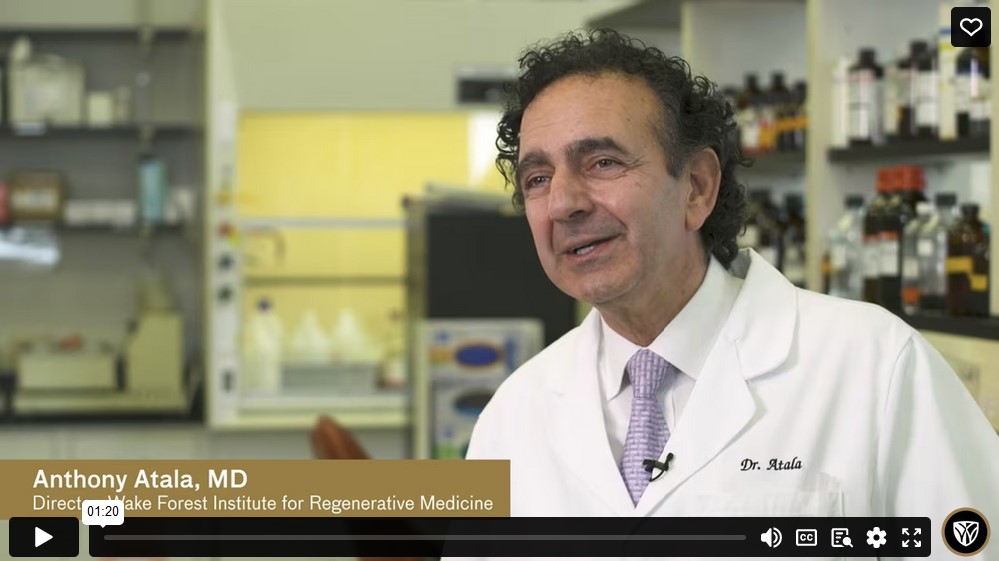
We are proud to be a part of WFIRM’s interdisciplinary landscape and our involvement with the RegeneratOR Test Bed. WFIRM Director Dr. Anthony Atala emphasizes the critical role of state-of-the-art facilities like the Test Bed to support novel prototyping and commercial product development for regenerative therapies. Naturally, we endorsed WFIRM’s $160 million NSF innovation grant bid this autumn, and we’re looking forward to the announcement of the winners.
technology.
Alongside our projects at WFIRM, we’re developing a quality management system for PHI, aligning our strategies with the clinical market’s evolving needs. This dual focus underscores our dedication to regenerative medicine and expansion to the clinical market.
Furthermore, we were proud during this quarter to present the PHI Board’s proposal for a direct share issue of 9.9 MSEK to our largest investor, Altium. It strengthened our partnership with Altium and stabilized our financial footing. I welcome Altium’s strong signal and the trust in the PHI team, enabling us to accelerate our GMP and regenerative medicine projects. As Goran Dubravčić, Altium CEO and PHI Chairman of the Board, highlights in the BioStock interview, “Altium fuels PHI’s forward drive”, their involvement is not just as an investor but as a partner with a shared vision for the future.
Embracing PHI’s transformation
We are in a transformative era at PHI, advancing steadily to the much larger clinical market and regenerative medicine. This year marks a pivotal moment, as we have secured a trusted long-term partnership and significant investment from Altium. This collaboration has injected a new level of confidence in our mission to establish HoloMonitor’s QPI technology as the gold standard in cell quality control. The strategic shift in our sales approach represents a significant move for PHI. It allows us to sharpen our focus on what we do best: innovation and product development. With Altium by our side and our central involvement at WFIRM, I see us optimally positioned, even as a small company. This quarter’s strategic shifts signal a transformative period for PHI, setting the stage for our future.
Wishing you a joyous holiday and God Jul.
Net Sales and Result
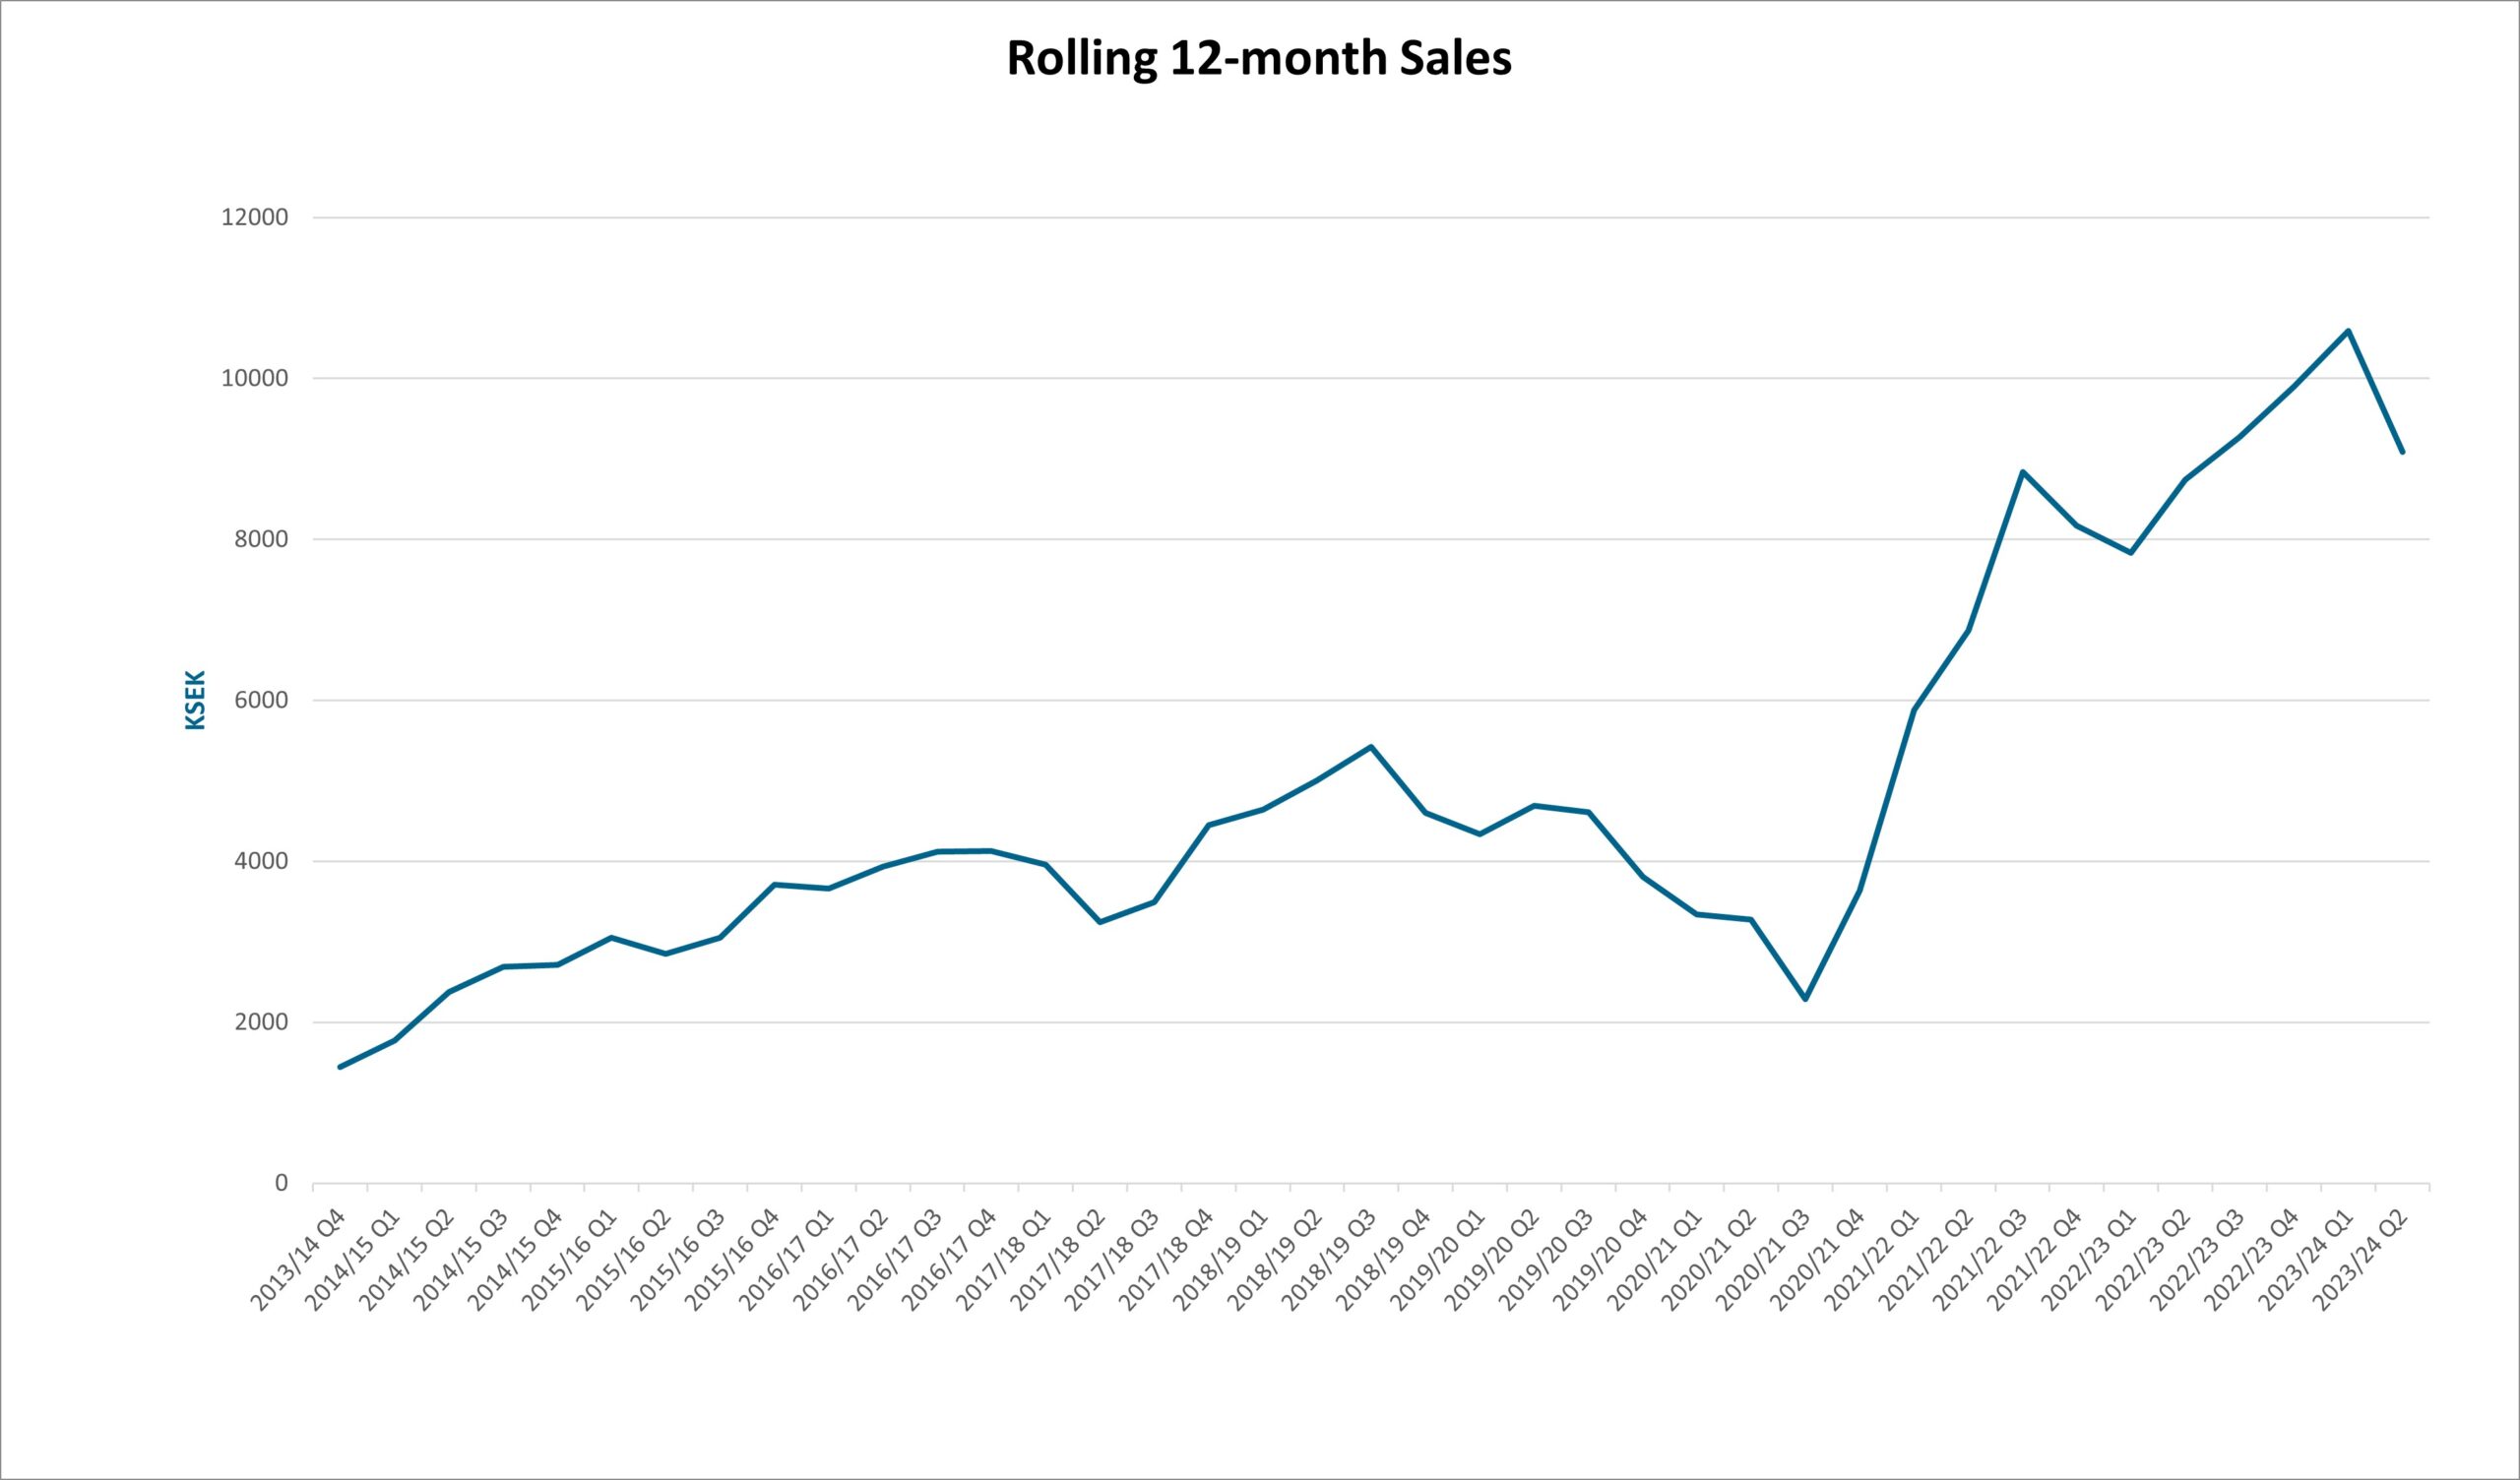
Net sales for the first quarter amounted to 1 225 (2 732) KSEK and operating results before depreciation (EBITDA) to -4 037 (-4 325) KSEK. The net result amounted to -5 375 (-5 304) KSEK.
Investments
With an emphasis on regenerative medicine and the development of fluorescence capability, the company invested 2 009 (864) KSEK in the product, patent, and application development during the period.
Financing
Cash, cash equivalents, and unutilized granted credits amounted to 787 (22 415) KSEK by the end of the period. The equity ratio was 17 (34) %.
*Note: Cash equivalents were restored after quarter 2 closing by a direct issue to Altium.
Warrants of series TO 3
On 2 May 2023, the exercise period for warrants of series TO 3 (“TO 3”), which were issued in connection with Phase Holographic Imaging PHI AB’s (“PHI” or the “Company”) rights issue of units that were announced on 22 February 2022, ended. 3 201 739 warrants of series TO 3 were exercised, corresponding to a subscription ratio of approximately 95.1 percent. Thus, the underwriting commitment relating to TO 3, which the Company agreed on during the exercise period, was activated. The decision on a directed share issue of 163 666 shares, corresponding to the remaining approximately 4.9 percent of the warrant exercise, to the underwriter Altium SA (“Altium”) was taken, with the support of the authorization given by the annual general meeting held on 31 October 2022. The proceeds of the TO 3 warrants amount to approximately SEK 12.7 million before the deduction of transaction-related costs, corresponding to a subscription rate of 100 percent.
Warrants of series TO 4
Each warrant of series TO 4 entitles to subscribe for one (1) new share in PHI during the period from and including 12 September 2024 to and including 3 October 2024. The exercise price amounts to 70 % of the volume-weighted average price during a period prior to option redemption, within the interval 0.20 SEK as the lowest, and with 15.45 SEK per new share as the highest exercise price. Upon full exercise of warrants of series TO 4 at the highest exercise price (15.45 SEK per new share), the warrants will provide the company with approximately 20.8 MSEK before issue costs.
Convertibles
The convertible loan to Formue Nord Fokus A/S end of October 2023 amounts to 20 230 000 SEK with the following terms:
- Number of convertibles: 1 700 000 convertibles, which entails the right to subscribe for 1 700 000 new shares.
- Conversion rates: 11.90 SEK per new share until 2 May 2023 (last day in the exercise period for warrants of series TO 3) and 15.45 SEK per new share from May 3, 2023, until October 16, 2024.
- Conversion period: the convertible holder is entitled during the period from the date of payment to October 16 2024 to convert the loan into shares.
- Maturity: in the event that the entire loan is not converted, repayment of the loan and interest must take place no later than October 16, 2024. The company has the right to repay all or part of the convertible loan at any time until the due date, after which Formue Nord has the opportunity to accept repayment or request conversion according to the above conversion rates.
- Interest: the convertibles run at a quarterly interest rate of 3%.
*Note: Change of ownership convertibles after quarter 2 closing
In November, Altium acquired the convertibles from Formue Nord A/S. On the take-over day, PHI had re-payed 6 360 KSEK on the convertible loan including accumulated interest. The convertible loan net amount that Altium took over amounted to 17 841 KSEK and the number of outstanding convertibles to 1 449 277 new shares.
Dilution of shares
| Total shares April 30, 2023 | 20 452 700 |
| TO 3 (April 2023, registered at Bolagsverket May 2023) | 3 365 405 |
| TO 4 (September 2024) | 1 346 162 |
| Convertibles | 1 449 277 |
| TOTAL | 26 613 544 |
Risks
The company may be affected by various factors, described in the 2021/22 Annual Report. These factors may individually or jointly increase risks for the operation and result of the company.
Accounting Principles
The accounts are prepared in accordance with the Annual Accounts Act and general advice from the Swedish Accounting Standards Board BFNAR 2012:1 Annual accounts and consolidated accounts (K3).
Review
This interim report has not been subject to review by the company’s auditor.
Statements About the Future
Statements concerning the company’s business environment and the future in this report reflect the board of director’s current view of future events and financial developments. Forward-looking statements only express the judgments and assumptions made by the board of directors on the day of the report. These statements have been carefully assessed. However, it is brought to the reader’s attention that these statements are associated with uncertainty, like all statements about the future.
Calendar
- End of September: Publication of annual report, which will be available in our office in Lund and on www.phiab.com
- 27th of March, 2024, Interim Report 3 2023/24
About PHI
Phase Holographic Imaging (PHI) develops and markets instrumentation for non-invasive time-lapse imaging. The company’s HoloMonitor product line is used for long-term quantitative analysis of living cell cultures, particularly in preclinical research and regenerative medicine. PHI is based in Lund, Sweden and Boston, Massachusetts.
On behalf of the Board of Directors
Patrik Eschricht, CEO
For additional information, please contact:
Patrik Eschricht
Tel: +46 702 69 99 61
E-mail: ir@phiab.com
Web: www.phiab.com
Consolidated – PHI Group
Income statement (KSEK)
| Q2 | Q2 | YTD | YTD | FY | |
| 2023/24 | 2022/23 | 2023/24 | 2022/23 | 2022/23 | |
| Net sales | 1 225 | 2 732 | 3 951 | 4 767 | 9 900 |
| Cost of products sold | -351 | -1 121 | -1 016 | -2 235 | -4 832 |
| Gross profit | 874 | 1 611 | 2 935 | 2 532 | 5 068 |
| Gross margin | 71% | 59% | 74% | 53% | 51% |
| Selling expenses | -2 623 | -2 582 | -5 395 | -5 660 | -10 468 |
| Administrative expenses | -671 | -2 022 | -1 790 | -3 839 | -8 170 |
| R&D expenses | -2 149 | -2 239 | -3 881 | -3 938 | -6 782 |
| Operating result (EBIT) | -4 569 | -5 232 | -8 131 | -10 905 | -20 352 |
| Financial net | -806 | -72 | -1 544 | -152 | -2 833 |
| Result before tax (EBT) | -5 375 | -5 304 | -9 675 | -11 057 | -23 185 |
| Net Result (EAT) | -5 375 | -5 304 | -9 675 | -11 057 | -23 185 |
Balance sheet (KSEK)
| Q2 | Q2 | FY | |
| 2023/24 | 2022/23 | 2022/23 | |
| ASSETS | |||
| Non-current assets | |||
| Intangible assets | 23 075 | 17 474 | 19 654 |
| Tangible assets | 664 | 231 | 608 |
| Total non-current assets | 23 739 | 17 705 | 20 262 |
| Current Assets | |||
| Inventory | 4 932 | 4 147 | 3 846 |
| Short-term receivables | 3 440 | 3 124 | 5 293 |
| Cash and equivalents | 122 | 20 415 | 5 308 |
| Total current assets | 8 494 | 27 686 | 14 447 |
| Total assets | 32 233 | 45 391 | 34 709 |
| EQUITY AND LIABILITIES | |||
| Equity | 5 546 | 15 544 | 3 728 |
| Financial liabilities | 18 191 | 22 248 | 20 580 |
| Operating liabilities | 8 496 | 7 599 | 10 401 |
| Total equity and liabilities | 32 233 | 45 391 | 34 709 |
Changes in equity (KSEK)
| Q2 | Q2 | FY | |
| 2023/24 | 2022/23 | 2022/23 | |
| Opening Balance | 11 398 | 21 134 | 26 983 |
| Net profit | -5 375 | -5 304 | -23 185 |
| Translation difference | -477 | -283 | -70 |
| Closing balance | 5 546 | 15 547 | 3 728 |
| Equity ratio | 17% | 34% | 11% |
Cash flow analysis (KSEK)
| Q2 | Q2 | YTD | YTD | FY | |
| 2023/24 | 2022/23 | 2023/24 | 2022/23 | 2022/23 | |
| Operating activities | |||||
| Net result | -5 717 | -5 303 | -9 675 | -11 057 | -23 185 |
| Depreciation | 873 | 826 | 1 742 | 1 731 | 3 486 |
| Translation difference | 140 | 70 | 140 | -87 | -70 |
| Operating cash flow | -4 703 | -4 407 | -7 793 | -9 413 | -19 644 |
| Increase (-)/decrease (+) in inventories | -579 | -149 | -1 086 | -1 168 | -867 |
| Increase (-)/decrease (+) in operating receivables | 8 651 | -524 | 1 982 | 32 937 | 30 639 |
| Increase (+)/decrease (-) in operating liabilities | -1 044 | 625 | -2 033 | 323 | 3 211 |
| Change in working capital | 7 028 | -48 | -1 137 | 32 092 | 32 983 |
| Cash flow from operating activities | 2 325 | -4 455 | -8 930 | 22 680 | 13 339 |
| Investing activities | |||||
| Development expenses | -2 009 | -864 | -4 249 | -2 130 | -5 938 |
| Patents | 50 | 25 | -179 | ||
| Tangible assets | -538 | ||||
| Cash flow after investments | 366 | -5 319 | -13 153 | 20 550 | 6 684 |
| Financing activities | |||||
| Net proceeds from equity issues | -136 | -404 | -383 | ||
| Increase (+)/decrease (-) in borrowings | -3 524 | -415 | -3 524 | -1 176 | -2 801 |
| Cash flow from financing activities | -3 660 | -819 | 7 968 | -1 559 | -2 801 |
| Cash flow for the period | -3 294 | -6 138 | -5 185 | 18 991 | 3 884 |
| Cash and cash equivalents at the beginning of the period | 3 416 | 26 553 | 5 307 | 1 424 | 1 424 |
| Cash and cash equivalents at the end of the period | 122 | 20 415 | 122 | 20 415 | 5 308 |
| Incl. unutilized credits | 787 | 22 415 | 787 | 22 415 | 7 307 |
Data per share
| Q2 | Q2 | YTD | YTD | FY | |
| 2023/24 | 2022/23 | 2023/24 | 2022/23 | 2022/23 | |
| Earnings per Share, SEK | -0.23 | -0.26 | -0.47 | -0.54 | -1.16 |
| Equity per share, SEK | 0.23 | 0.76 | 0.23 | 0.76 | 0.18 |
| Number of Shares, end of period | 23 818 105 | 20 452 700 | 23 818 105 | 20 452 700 | 20 452 700 |
| Average number of shares | 23 376 740 | 20 452 700 | 20 452 700 | 20 452 700 | 20 070 980 |
| Share price end of period, SEK | 6.26 | 2.97 | 6.26 | 2.97 | 5.16 |
Parent company
Income statement (KSEK)
| Q2 | Q2 | YTD | YTD | FY | |
| 2023/24 | 2022/23 | 2023/24 | 2022/23 | 2022/23 | |
| Net sales | 685 | 2 283 | 3 039 | 4 129 | 9 837 |
| Cost of products sold | -358 | -1 421 | -1 010 | -2 497 | -4 968 |
| Gross profit | 327 | 862 | 2 029 | 1 633 | 4 869 |
| Gross margin | 48% | 38% | 67% | 40% | 49% |
| Selling expenses | -1 284 | -1 598 | -2 830 | -3 725 | -6 076 |
| Administrative expenses | -671 | -2 022 | -1 789 | -3 839 | -8 170 |
| R&D expenses | -2 149 | -2 239 | -3 881 | -3 938 | -6 782 |
| Operating result (EBIT) | -3 777 | -4 997 | -6 471 | -9 870 | -16 159 |
| Financial net | -806 | -72 | -1 544 | -152 | -2 836 |
| Result before tax (EBT) | -4 583 | -5 069 | -8 015 | -10 022 | -18 995 |
| Net Result (EAT) | -4 583 | -5 069 | -8 015 | -10 022 | -18 995 |
Balance sheet (KSEK)
| Q2 | Q2 | FY | |
| 2023/24 | 2022/23 | 2022/23 | |
| ASSETS | |||
| Non-current assets | |||
| Intangible assets | 22 252 | 17 474 | 19 654 |
| Tangible assets | 664 | 231 | 608 |
| Financial assets | 11 416 | 8 795 | |
| Total non-current assets | 34 332 | 17 705 | 29 057 |
| Current Assets | |||
| Inventory | 4 376 | 3 312 | 3 332 |
| Short-term receivables | 2 606 | 8 889 | 4 080 |
| Cash and equivalents | 18 634 | 4 988 | |
| Total current assets | 6 982 | 30 835 | 12 400 |
| Total assets | 41 314 | 48 540 | 41 457 |
| EQUITY AND LIABILITIES | |||
| Equity | 14 623 | 19 490 | 10 518 |
| Financial liabilities | 18 191 | 22 380 | 20 580 |
| Operating liabilities | 8 500 | 6 670 | 10 359 |
| Total equity and liabilities | 41 314 | 48 540 | 41 457 |
