Interim Report 2 2025/26
Phase Holographic Imaging PHI AB (publ)
Lund, December 19, 2025
AUGUST 2025 – OCTOBER 2025
| Net sales | 306 (2 977) KSEK |
| Operating result before depreciation (EBITDA) | -5 445 (-2 789) KSEK |
| Net result | -7 761 (-3 669) KSEK |
| Earnings per share | -0,12 (-0,14) SEK |
| Gross margin | 60 (55) % |
MAY 2025 – OCTOBER 2025
| Net sales | 671 (4 315) KSEK |
| Operating result before depreciation (EBITDA) | -12 494 (-7 523) KSEK |
| Net result | -16 303 (-9 599) KSEK |
| Earnings per share | -0,26 (-0,37) SEK |
| Gross margin | 65 (63) % |
In Short
- Sales growth is affected by the transition of sales to PHI from Altium, and customers may be waiting for our next generation of Holomonitor.
- PHi is expanding its technology into IVF, with a first step for cows and horses.
- The launch of Holomonitor Next Generation was on the 17th of December, after Q1 ending.
CEO Commentary
PHI second quarter update: strategic progress amid transition
Navigating challenges and building for growth
As we close out the second quarter of our fiscal year, I want to begin by acknowledging that sales this quarter have been more modest than anticipated. While we have made meaningful progress on several strategic fronts, the pace of revenue acceleration has been slower than expected and desired.
One contributing factor has been the longer-than-planned transition of sales from Altium back to PHI, which required additional time and resources to ensure a smooth and effective process. We also recognize that some customers may be deferring purchases in anticipation of our next-generation HoloMonitor®, announced earlier this year. This dynamic underscores the importance of delivering the new platform on schedule and executing a strong launch strategy to capture this pent-up demand.
Despite these challenges, we remain confident in our ability to navigate this transition successfully and convert these dynamics into future growth opportunities.
Strategic expansion: entering the veterinary IVF market
Arguably the most significant development this quarter has been our decision to expand into the in vitro fertilization (IVF) market for livestock. In October, we announced that PHI is leveraging its core QPI technology to address critical challenges in assessing oocytes and embryos in animal breeding.
This is a natural and highly promising extension of our capabilities. By applying our next-generation HoloMonitor® platform, we believe we can offer non-invasive, label-free imaging to improve the consistency and scalability of IVF processes in cows and horses. We have also filed a trademark application for “HoloOocyte” to signal our commitment to this new vertical.
This move marks a deliberate broadening of our market reach – beyond regenerative medicine and cell therapy into the fast-growing agri-biotech space. We view this not only as a strategic diversification but as a significant opportunity to scale our technology in a highly relevant and underserved area.
Product innovation: Holomonitor Next Generation on track
Important update on the development of our Holomonitor Next Generation®. We launched the system on the 17th of December.
With the launch of our next-generation HoloMonitor®, we are targeting more clinically focused applications and expanding into larger market segments, while laying the foundation for future expansion. Our immediate priority is to accelerate adoption among existing customer segments—academic research, regenerative medicine, and cell therapy—where we already have proven traction and strong relationships. The enhanced performance and usability of the new platform are designed to deepen engagement with these clients and unlock additional sales opportunities in the near term.
At the same time, we are strategically investing in new applications such as embryo and oocyte assessment. These markets hold exciting potential but will require validation and collaboration before they translate into revenue. We view this as a deliberate, phased approach: secure growth in our core markets now, while building the capabilities and partnerships that will enable us to scale into larger segments over time.
PHI has within this area the following patent https://patents.google.com/patent/EP2446251A1/en
Looking ahead: building momentum
The strategic additions and operational ramp-up this quarter give me great confidence in PHI’s trajectory. Entering the veterinary IVF market positions us in a differentiated niche with significant potential. Meanwhile, the upcoming launch of our Holomonitor Next Generation underscores our commitment to innovation.
However, we are not naive about the challenges ahead. Scaling into new market segments, especially in agricultural biotechnology, demands validation, customer education, and careful execution. Simultaneously, the commercial success of our Holomonitor Next Generation will depend not only on technology but also on adoption by key clinical and research partners.
To meet these challenges, we remain focused on three core pillars:
• Strategic new markets – Building our presence in veterinary IVF and other adjacent fields where our QPI technology can deliver differentiated value.
• Innovation excellence – Delivering our Holomonitor Next Generation with superior performance and usability.
• Commercial execution – Growing our global sales network, including leveraging local partners.
I want to thank our dedicated team, our partners, and of course, our shareholders. Your continued support and belief in PHI are what make this next phase of growth possible. We understand that our potential lies not only in what we do today, but in the vision we are building for tomorrow – a future where non-invasive, label-free cell imaging shapes innovation across medicine and beyond.
Together, we are writing a new chapter for PHI – one defined by innovation, expansion, and meaningful impact.
Finally, I want to note that PHI’s current capital resources are approaching their limits. The Board of Directors and I are actively working on a solution and are optimistic it will be finalized soon. This remains a top priority, and we will keep our stakeholders informed as developments progress.
Thank you.

About PHI
Phase Holographic Imaging (PHI), a leading medical technology company, develops and markets its non-invasive time-lapse imaging instruments for studying living cells.
The foundation of PHI’s current commercial HoloMonitor® products is Quantitative Phase Imaging (QPI) technology. This technology brings an innovative approach to real-time cell quality evaluation. It offers a detailed analysis of a large number of cell health and behavior characteristics without harming or influencing living cells and thus differing from conventional measurement methods, which often jeopardize cell integrity.
PHI is actively focusing on developing its business to expand from its current pre-clinical research market to the sizable healthcare industry and the emerging regenerative medicine field.
PHI envisions setting a new benchmark with QPI as a gold standard method for cell quality control, enabling regenerative treatments to advance and making future cell therapies safe, reliable, and economically and universally accessible for patients worldwide.
The addressable market
PHI has been active within the pre-clinical and biomedical cell research market, having established a global presence with HoloMonitor® systems and their scientific validation in both academia and industry, primarily addressing cancer, stem cell and drug development research.
PHI’s HoloMonitor technology is transforming pre-clinical research by providing a foundation for better cell models, which are critical before clinical drug testing. This innovative approach, utilizing Quantitative Phase Imaging (QPI), ensures cells remain unaffected during analysis. Unlike conventional cell measurement methods that often require genetic manipulation or staining with toxic substances, QPI offers a non-invasive alternative that maintains the integrity of cell cultures. This advancement addresses the critical need for accurate, cost-efficient preclinical data to reduce the high failure rates in drug development. With 9 out of 10 drugs failing in clinical trials due to ineffective results or adverse effects, largely stemming from flawed preclinical outcomes, PHI’s technology represents a significant leap forward. By enabling scientists to obtain better data without compromising cell health, HoloMonitor sets a new standard in drug development and basic medical research, aiming for more successful patient outcomes and reduced research expenses.
PHI is strategically prepared to extend its reach into the large clinical market and emerging regenerative medicine field, which presents significant growth opportunities. By striving to achieve Good Manufacturing Practice (GMP) standards and create a company quality management system (QMS), PHI aims to penetrate these markets in the future, where its non-invasive cell analysis solutions can offer critical cell quality control assessment.
Regenerative medicine is a groundbreaking field focused on developing methods to regenerate, repair, or replace damaged cells, tissues, or organs. It integrates biology, chemistry, computer science, and engineering to develop treatments for conditions previously thought untreatable. It has already begun to transform healthcare by offering new hope to patients with conditions like cancer, Parkinson’s disease, diabetes, and deafness, displaying its vast potential to improve and save lives around the globe.
Business model & strategy
PHI markets a competitive combination of sophisticated software and quality hardware, constantly evolving its offerings through in-house development in response to changing market needs. The production of the hardware and accessories is strategically outsourced to specialized subcontractors located in Sweden.
PHI’s business model strategically centers around the HoloMonitor portfolio, designed to meet the specific needs of academia and industry research labs. The company prioritizes direct interactions and live product demonstrations at potential customer facilities, particularly in cell-based research environments. Combined with a digital marketing approach, this sales strategy is essential for demonstrating HoloMonitor’s advantages firsthand, aiming to foster trust and enabling customers to assess its suitability for their unique research needs. The sales process at PHI is designed to align with the detailed and extended decision-making cycles often found within the scientific community. It accounts for the crucial phase of securing grant funding or other financial support for institutions looking to invest in new research equipment. As a result, sales cycles typically span 6 to 12 months.
Phase Holographic Imaging (PHI) is assuming full control of its global sales operations as part of a strategic initiative to accelerate international growth. While continuing to strengthen its presence in core markets—North America, Europe, Asia, and Australia—PHI is also actively entering new territories to broaden its global footprint.
Achieving future goals
PHI is focusing on achieving important milestones in the coming years, utilizing the potential of its partnerships and collaborations. PHI has a clear focus on expanding its business to the clinical research market and IVF.
PHI engages in these strategic relationships to fortify the Company’s position as a thought leader in the field with the intention to accelerate progress, bolster market penetration, open new doors to new business opportunities, and enhance shareholder value.
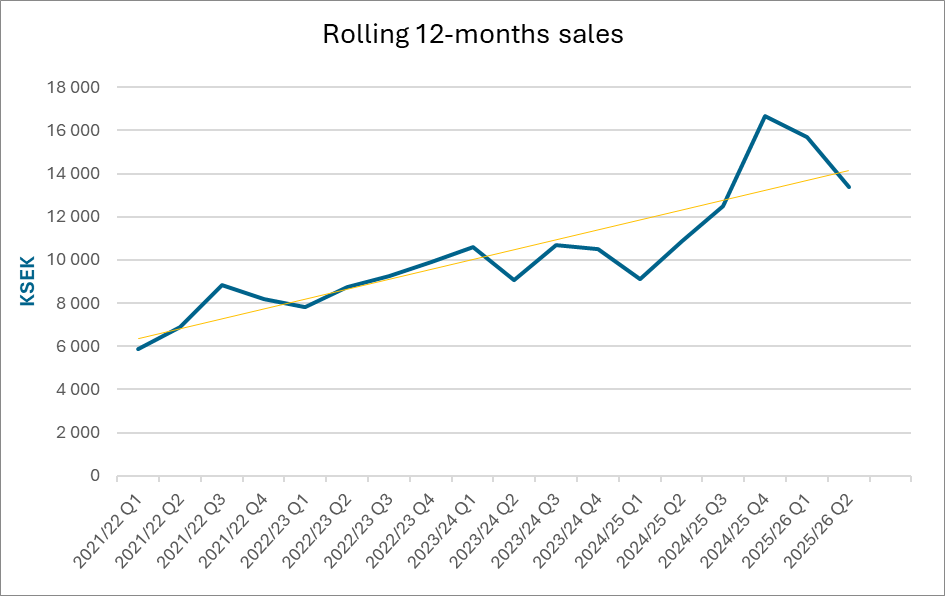
Net Sales and Result
Net sales for the second quarter amounted to 306 (2 977) KSEK. Operating results before depreciation (EBITDA) amounted to -5 446 (-2 789) KSEK for the second quarter. The net result for the second quarter amounted to -7 761 (-3 669) KSEK.
Investments
The company invested 1 096 (2 335) KSEK in the product, patent, and application development during the second quarter.
Financing
Cash, cash equivalents, and unutilized granted credits amounted to 4 221 (9 924) KSEK by the end of the period. The equity ratio was 89 (1) %.
Risks
The company may be affected by various factors, described in the 2024/25 Annual Report. These factors may individually or jointly increase risks for the operation and result of the company.
Accounting Principles
The accounts are prepared in accordance with the Annual Accounts Act and general advice from the Swedish Accounting Standards Board BFNAR 2012:1 Annual accounts and consolidated accounts (K3).
Review
This interim report has not been subject to review by the company’s auditor.
Statements About the Future
Statements concerning the company’s business environment and the future in this report reflect the board of director’s current view of future events and financial developments. Forward-looking statements only express the judgments and assumptions made by the board of directors on the day of the report. These statements have been carefully assessed. However, it is brought to the reader’s attention that these statements are associated with uncertainty, like all statements about the future.
Calendar
- 26th of March Interim Report 3 2025/2026
About PHI
Phase Holographic Imaging (PHI) is a medical technology company that develops and markets its non-invasive, time-lapse imaging instruments for long-term quantitative analysis of living cells. The foundation of PHI’s current commercial HoloMonitor® products is Quantitative Phase Imaging (QPI) — a technology that heralds an innovative approach to cell quality evaluation. It offers a detailed analysis of cell characteristics without harming the cells, avoiding the limitations of traditional measurement methods. PHI is actively focusing on business development to expand from pre-clinical research to the clinical market and the emerging regenerative medicine field. PHI envisions transforming live cell analysis and establishing QPI as a standard for cell quality control, making our future cell therapies safe, affordable, and accessible for patients. PHI is based in Lund, Sweden, Boston, MA and Winston-Salem, NC.
On behalf of the Board of Directors
Patrik Eschricht, CEO
For additional information, please contact:
Patrik Eschricht
Tel: +46 702 69 99 61
E-mail: ir@phiab.com
Web: www.phiab.com
Consolidated – PHI Group
Income statement (KSEK)
| Q2 | Q2 | YTD | YTD | FY | |
| 2025/26 | 2024/25 | 2025/26 | 2024/25 | 2024/25 | |
| Net sales | 306 | 2 977 | 671 | 4 315 | 16 646 |
| Cost of products sold | -123 | -1 349 | -238 | -1 583 | -4 409 |
| Gross profit | 184 | 1 628 | 433 | 2 732 | 12 237 |
| Gross margin | 60% | 55% | 65% | 63% | 74% |
| Selling expenses | -2 407 | -2 443 | -5 683 | -4 890 | -9 104 |
| Administrative expenses | -2 227 | -876 | -5 051 | -3 156 | -10 870 |
| R&D expenses | -2 697 | -1 489 | -5 597 | -2 988 | -7 215 |
| Operating result (EBIT) | -7 148 | -3 179 | -15 898 | -8 302 | -14 952 |
| Financial net | -613 | -490 | -405 | -1 297 | -2 568 |
| Result before tax (EBT) | -7 761 | -3 669 | -16 303 | -9 599 | -17 519 |
| Net Result (EAT) | -7 761 | -3 669 | -16 303 | -9 599 | -17 519 |
Balance sheet (KSEK)
| YTD | YTD | FY | |
| 2025/26 | 2024/25 | 2024/25 | |
| ASSETS | |||
| Non-current assets | |||
| Intangible assets | 29 280 | 29 403 | 30 345 |
| Tangible assets | 897 | 872 | 1 048 |
| Financial assets | 130 | 132 | |
| Total non-current assets | 30 306 | 30 275 | 31 525 |
| Current Assets | |||
| Inventory | 2 815 | 2 314 | 2 640 |
| Short-term receivables | 1 570 | 2 198 | 7 244 |
| Cash and equivalents | 2 221 | 7 919 | 14 443 |
| Total current assets | 6 607 | 12 431 | 24 327 |
| Total assets | 36 913 | 42 706 | 55 853 |
| EQUITY AND LIABILITIES | |||
| Equity | 32 725 | 545 | 48 738 |
| Financial liabilities | 18 129 | ||
| Operating liabilities | 4 188 | 24 032 | 7 115 |
| Total equity and liabilities | 36 913 | 42 706 | 55 853 |
Changes in equity (KSEK)
| YTD | YTD | FY | |
| 2025/26 | 2024/25 | 2024/25 | |
| Opening Balance | 48 738 | 4 988 | 4 988 |
| Equity issues, net | 5 154 | 59 535 | |
| Net profit | -16 303 | -9 599 | -17 520 |
| Translation difference | 290 | 1 735 | |
| Closing balance | 32 725 | 545 | 48 738 |
| Equity ratio | 89% | 1% | 87 % |
Cash flow analysis (KSEK)
| Q2 | Q2 | YTD | YTD | FY | |
| 2025/26 | 2024/25 | 2025/26 | 2024/25 | 2024/25 | |
| Operating activities | |||||
| Net result | -7 761 | -3 669 | -16 303 | -9 599 | -17 520 |
| Depreciation | 1 702 | 390 | 3 404 | 779 | 2 881 |
| Translation difference | 575 | -3 | 373 | 56 | 2 241 |
| Operating cash flow | -5 484 | -3 283 | -12 529 | -8 764 | -12 397 |
| Increase (-)/decrease (+) in inventories | -1 446 | 1 336 | -190 | 1 418 | 983 |
| Increase (-)/decrease (+) in operating receivables | 165 | 1 225 | 5 670 | 176 | -4 899 |
| Increase (+)/decrease (-) in operating liabilities | -577 | 6 112 | -991 | 13 863 | -2 295 |
| Change in working capital | -1 859 | 8 673 | 4 486 | 15 457 | -6 211 |
| Cash flow from operating activities | -7 343 | 5 390 | -8 039 | 6 693 | -18 608 |
| Investing activities | |||||
| Development expenses | -1 096 | -2 385 | -2 242 | -4 381 | -7 694 |
| Tangible assets | -322 | ||||
| Cash flow after investments | -8 439 | 3 004 | -10 281 | 2 312 | -26 624 |
| Financing activities | |||||
| Net proceeds from equity issues | 4 930 | 5 154 | 59 535 | ||
| Increase (+)/decrease (-) in borrowings | -28 | 284 | -18 791 | ||
| Utilized credits | -1 932 | 195 | |||
| Cash flow from financing activities | 4 902 | -1 932 | 5 438 | 40 938 | |
| Cash flow for the period | – 8 439 | 7 906 | -12 214 | 7 750 | 14 315 |
| Cash and cash equivalents at the beginning of the period | 10 670 | 10 | 14 443 | 167 | 167 |
| Cash and cash equivalents at the end of the period | 2 221 | 7 919 | 2 221 | 7 919 | 14 443 |
| Incl. unutilized credits | 4 221 | 9 818 | 4 221 | 9 918 | 14 509 |
Data per share
| Q2 | Q2 | YTD | YTD | FY | |
| 2025/26 | 2024/25 | 2025/26 | 2024/25 | 2024/25 | |
| Earnings per Share, SEK | -0,12 | -0,14 | -0,26 | -0,37 | -0,40 |
| Equity per share, SEK | 0,52 | 0,02 | 0,52 | 0,02 | 0,77 |
| Number of Shares, end of period | 63 051 780 | 27 322 438 | 63 051 780 | 27 322 438 | 63 051 780 |
| Average number of shares | 63 051 780 | 26 364 807 | 63 051 780 | 26 278 866 | 44 238 600 |
| Share price end of period, SEK | 0,99 | 4,47 | 0,99 | 4,47 | 1,40 |
Parent company
Income statement (KSEK)
| Q2 | Q2 | YTD | YTD | FY | |
| 2025/26 | 2024/25 | 2025/26 | 2024/25 | 2024/25 | |
| Net sales | 307 | 2 964 | 595 | 4 259 | 16 101 |
| Cost of products sold | -123 | -1 347 | -238 | -1 570 | -4 288 |
| Gross profit | 184 | 1 617 | 357 | 2 689 | 11 813 |
| Gross margin | 60% | 55% | 60% | 63% | 73% |
| Selling expenses | -1 864 | -1 286 | -3 681 | -2 479 | -4 279 |
| Administrative expenses | -2 227 | -876 | -5 051 | -3 156 | -10 863 |
| R&D expenses | -2 697 | -1 489 | -5 597 | -2 988 | -7 215 |
| Operating result (EBIT) | -6 604 | -2 034 | -13 972 | -5 934 | -10 544 |
| Financial net | -627 | -490 | -1 346 | -1 297 | -20 842 |
| Result before tax (EBT) | -7 231 | -2 524 | -15 318 | -7 231 | -31 386 |
| Net Result (EAT) | -7 231 | -2 524 | -15 318 | -7 231 | -31 386 |
Balance sheet (KSEK)
| YTD | YTD | FY | |
| 2025/26 | 2024/25 | 2024/25 | |
| ASSETS | |||
| Non-current assets | |||
| Intangible assets | 26 589 | 27 109 | 27 600 |
| Tangible assets | 897 | 872 | 1 048 |
| Financial assets | 25 | 16 295 | 25 |
| Total non-current assets | 27 511 | 44 276 | 28 673 |
| Current Assets | |||
| Inventory | 2 061 | 1 336 | 1 871 |
| Short-term receivables | 1 524 | 2 007 | 6 992 |
| Cash and equivalents | 1 958 | 7 915 | 13 777 |
| Total current assets | 5 543 | 11 258 | 22 640 |
| Total assets | 33 055 | 55 534 | 51 314 |
| EQUITY AND LIABILITIES | |||
| Equity | 28 931 | 13 791 | 44 249 |
| Financial liabilities | 17 841 | ||
| Operating liabilities | 4 124 | 23 903 | 7 065 |
| Total equity and liabilities | 33 055 | 47 048 | 51 314 |