Year-end Report 2021/22
Phase Holographic Imaging PHI AB (publ)
Lund, June 29, 2022
february 2022 – april 2022
| Net sales | 1 242 (1 910) KSEK |
| Operating result before depreciation (EBITDA) | -3 173 (-5 559) KSEK |
| Net result | -10 279 (-6 784) KSEK |
| Earnings per share | -0.71 (-0.47) SEK |
| Gross margin | 63 (66) % |
MAY 2021 – APRIL 2022
| Net sales | 8 169 (3 637) KSEK |
| Operating result before depreciation (EBITDA) | -14 971 (-16 773) KSEK |
| Net result | -25 381 (-23 509) KSEK |
| Earnings per share | -1.76 (-1.63) SEK |
| Gross margin | 70 (63) % |
In short
- Sales more than doubled in 2021/22, compared to previous financial year.
- Sales of the HoloMonitor fluorescence unit have begun for delivery in the fall of 2022.
- The synthetic antibody patent previously awarded to PHI in the USA has also been granted in Japan.
CEO Commentary
Sales
The restructuring of our distribution network combined with our investment in online sales and marketing has doubled sales in 2021/22, compared to previous financial year. Instrument sales accounted for the greater part, although a noticeable amount was additional software, service and consumables.
Business Development
Fluorescence module
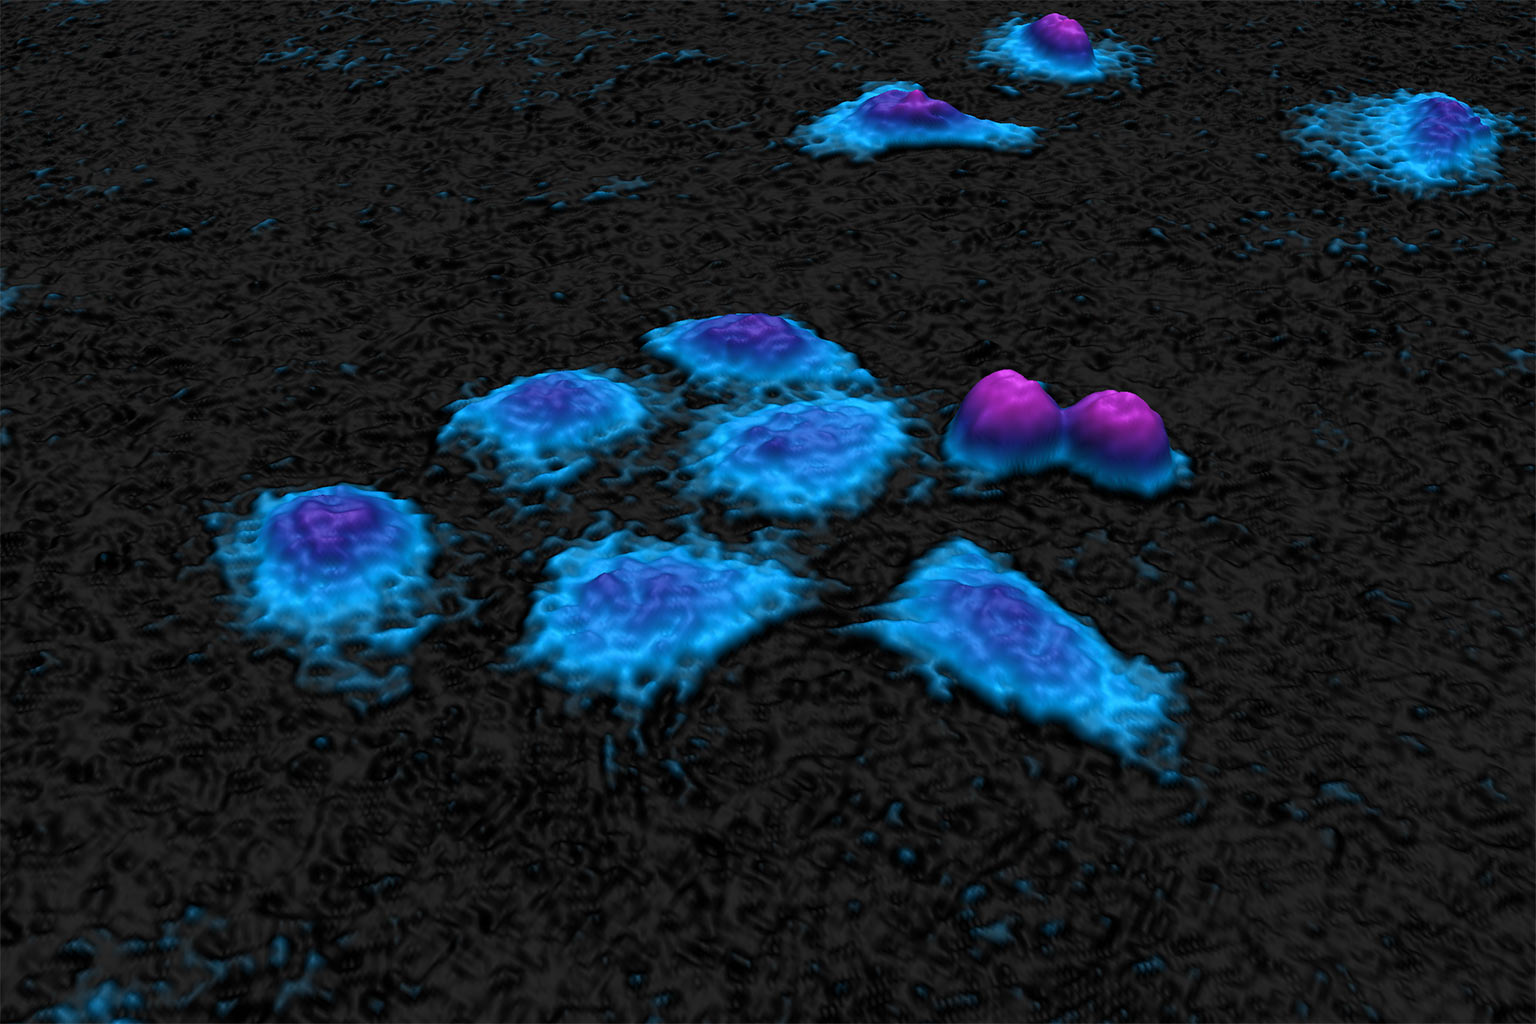
We regularly receive inquiries from customers regarding HoloMonitor’s fluorescence unit. After recently locking the design and securing materials and components for the first production units, we are now in good position to offer for delivery during the autumn.
Fluorescence imaging is an essential tool in medical research as the method allows the genetic activity of cells to be characterized. However, fluorescence imaging is toxic to the cells. By combing holographic and fluorescence microscopy, HoloMonitor dramatically reduces the toxicity when imaging living cells using fluorescence microscopy, particularly when imaging multiple cell cultures over time. Additionally, the cost and complexity of fluorescence imaging are reduced.
Synthetic antibodies
The synthetic antibody patent previously awarded to PHI in the USA has also been granted in Japan. The granted patents protect technology for creating engineered antibodies that can be tailored to recognize and bind to specific molecules with high precision to, for example, identify cancer cells in blood or tissue samples. With the prospect of grants in Europe and China, the granted patents have prompted us to consider how we commercialize the obtained intellectual property rights in an optimal way.
Regenerative medicine
By repairing or replacing dysfunctional cells, tissues and organs, regenerative therapies promise to treat injuries and diseases like Alzheimer’s, Parkinson’s, diabetes and cardiovascular disorders that are untreatable today.
PHI was invited to speak at the World Stem Cell Summit, organized by the Wake Forest Institute for Regenerative Medicine. For regenerative therapies to become affordable and available to all, the problem of large-scale production must be solved. I was, therefore, asked to speak about “Advanced Quality Control for Regenerative Medicine” at the summit.
It is well known in the field that cell morphology changes when cell quality deteriorates. Unlike other products on the market, HoloMonitor can non-invasively image and quantify individual cell morphology in a cell incubator environment. This unique ability makes our HoloMonitor technology perfectly suited for quality assessment in large-scale production of regenerative therapies.

Over 20 billion USD was invested in regenerative therapies in 2021, according to the Alliance for Regenerative Medicine. Also, according to the alliance, over 2 000 ongoing regenerative clinical trials are currently conducted by 1 200 therapeutic developers.
Net sales and result
Net sales for the fourth quarter amounted to 1 242 (1 910) KSEK and operating results before depreciation (EBITDA) to -3 173 (-5 559) KSEK. The net result amounted to -10 279 (-6 784) KSEK.
Rolling 12-month sales
Investments
With an emphasis on application development and the development of fluorescence capability, the company invested 2 674 (1 554) KSEK in the product, patent, and application development during the period.
Financing
Cash, cash equivalents, and unutilized granted credits amounted to 2 508 (35 506) KSEK by the end of the period. The equity ratio was 47 (25) %.
In connection with the rights issue being registered after the balance sheet date in May, PHI received 32.2 MSEK after issuing costs and repayment of loans to Formue A/S.
Rights issue
The rights issue, which ended on April 13, 2022, was subscribed for a total of approximately 57 MSEK, corresponding to a total subscription ratio of 80 %. Through the rights issue, a total of 6 057 729 shares and 3 365 405 new series of series TO 3 and 1 346 162 warrants of series TO 4 will be newly issued. PHI thus received approximately 57 MSEK before issue costs. As of May 12, 2022, the number of shares in PHI amounts to 20 452 700 with a share capital of 4 090 540 SEK.
Warrants of series TO 3
Each warrant of series TO 3 entitles to subscribe for one (1) new share in PHI during the period from 11 April 2023 to 2 May 2023. The exercise price amounts to 70 % of the volume-weighted average price during a period prior to option redemption, within the interval 0.20 SEK (the company’s quota value) as the lowest, and with 11.90 SEK per new share as the highest exercise price. Upon full exercise of warrants of series TO 3 at the highest exercise price (11.90 SEK per new share), the warrants will provide the company with approximately 40 MSEK before issue costs.
Warrants of series TO 4
Each warrant of series TO 4 entitles to subscribe for one (1) new share in PHI during the period from and including 12 September 2024 to and including 3 October 2024. The exercise price amounts to 70 % of the volume-weighted average price during a period prior to option redemption, within the interval 0.20 SEK as the lowest, and with 15.45 SEK per new share as the highest exercise price. Upon full exercise of warrants of series TO 4 at the highest exercise price (15.45 SEK per new share), the warrants will provide the company with approximately 20.8 MSEK before issue costs.
Convertibles
The convertible loan to Formue Nord Fokus A / S amounts to 20 230 000 SEK with the following terms:
- Number of convertibles: 1 700 000 convertibles, which entails the right to subscribe for 1 700 000 new shares.
- Conversion rates: 11.90 SEK per new share until 2 May 2023 (last day in the exercise period for warrants of series TO 3) and 15.45 SEK per new share from May 3, 2023, until October 16, 2024.
- Conversion period: the convertible holder is entitled during the period from the date of payment to October 16 2024 to convert the loan into shares.
- Maturity: in the event that the entire loan is not converted, repayment of the loan and interest must take place no later than October 16, 2024. The company has the right to repay all or part of the convertible loan at any time until the due date, after which Formue Nord has the opportunity to accept repayment or request conversion according to the above conversion rates.
- Interest: the convertibles run at a quarterly interest rate of 3%.
Risks
The company may be affected by various factors, described in the 2020/21 Annual Report. These factors may individually or jointly increase risks for the operation and result of the company.
Accounting principles
The accounts are prepared in accordance with the Annual Accounts Act and general advice from the Swedish Accounting Standards Board BFNAR 2012:1 Annual accounts and consolidated accounts (K3).
Review
This interim report has not been subject to review by the company’s auditor.
Statements about the future
Statements concerning the company’s business environment and the future in this report reflect the board of director’s current view of future events and financial developments. Forward-looking statements only express the judgments and assumptions made by the board of directors on the day of the report. These statements have been carefully assessed. However, it is brought to the reader’s attention that these statements are associated with uncertainty, like all statements about the future.
Calendar
- September 2022, Annual Report 2021/22
- September 29 2022, Interim Report 1 2022/23
About PHI
Phase Holographic Imaging (PHI) develops and markets instrumentation for non-invasive time-lapse imaging. The company’s HoloMonitor product line is used for long-term quantitative analysis of living cell cultures, particularly in preclinical research and regenerative medicine. PHI is based in Lund, Sweden and Boston, Massachusetts.
On behalf of the Board of Directors
Peter Egelberg, CEO
For additional information please contact:
Peter Egelberg
Tel: +46 703 19 42 74
E-mail: ir@phiab.se
Web: www.phiab.com
Consolidated – PHI Group
Income statement (KSEK)
| Q4 | Q4 | FY | FY | |
| 2021/22 | 2020/21 | 2021/22 | 2020/21 | |
| Net sales | 1 242 | 1 910 | 8 169 | 3 637 |
| Cost of products sold | -524 | -647 | -2 485 | -1 346 |
| Gross profit | 718 | 1 263 | 5 684 | 2 291 |
| Gross margin | 63% | 66% | 70% | 63% |
| Selling expenses | -2 174 | -3 511 | -9 303 | -8 773 |
| Administrative expenses | -772 | -1 775 | -7 388 | -7 084 |
| R&D expenses | -2 806 | -2 571 | -8 817 | -11 720 |
| Operating income | 1 972 | |||
| Operating result (EBIT) | -5 034 | -6 594 | -19 824 | -23 314 |
| Financial net | -5 245 | -190 | -5 557 | -195 |
| Result before tax (EBT) | -10 279 | -6 784 | -25 381 | -23 509 |
| Net Result (EAT) | -10 279 | -6 784 | -25 381 | -23 509 |
Balance sheet (KSEK)
| FY | FY | |
| 2021/22 | 2020/21 | |
| ASSETS | ||
| Non-current assets | ||
| Intangible assets | 17 038 | 14 823 |
| Tangible assets | 181 | 337 |
| Total non-current assets | 17 219 | 15 160 |
| Current Assets | ||
| Inventory | 2 979 | 1 334 |
| Short-term receivables | 35 792 | 3 017 |
| Cash and equivalents | 1 424 | 2 256 |
| Total current assets | 40 195 | 6 607 |
| Total assets | 57 414 | 21 767 |
| EQUITY AND LIABILITIES | ||
| Equity | 26 983 | 5 384 |
| Financial liabilities | 22 508 | 7 400 |
| Operating liabilities | 7 923 | 8 983 |
| Total equity and liabilities | 57 414 | 21 767 |
Changes in equity (KSEK)
| FY | FY | |
| 2021/22 | 2020/21 | |
| Opening Balance | 5 384 | 28 896 |
| Equity issues, net | 47 268 | |
| Net profit | -25 381 | -23 509 |
| Translation difference | -288 | -3 |
| Closing balance | 26 983 | 5 384 |
| Equity ratio | 47% | 25% |
Cash flow analysis (KSEK)
| Q4 | Q4 | FY | FY | |
| 2021/22 | 2020/21 | 2021/22 | 2020/21 | |
| Operating activities | ||||
| Net result | -10 280 | -6 784 | -25 382 | -23 509 |
| Depreciation | 1 862 | 1 035 | 4 854 | 6 541 |
| Translation difference | -353 | -7 | -491 | -4 |
| Operating cash flow | -8 771 | -5 756 | -21 019 | -16 972 |
| Increase (-)/decrease (+) in inventories | -762 | 327 | -1 645 | 196 |
| Increase (-)/decrease (+) in operating receivables | -31 972 | -392 | -32 854 | -348 |
| Increase (+)/decrease (-) in operating liabilities | 2 799 | 3 100 | -981 | 2 882 |
| Change in working capital | -29 935 | 3 035 | -35 480 | 2 730 |
| Cash flow from operating activities | -38 706 | -2 721 | -16 335 | -14 242 |
| Investing activities | ||||
| Development expenses | -2 504 | -1 384 | -6 539 | -4 091 |
| Patents | -170 | -170 | -170 | -170 |
| Tangible assets | ||||
| Cash flow after investments | -41 380 | -4 275 | -63 208 | -18 503 |
| Financing activities | ||||
| Net proceeds from equity issues | 47 268 | 47 268 | ||
| Increase (+)/decrease (-) in borrowings | -6 255 | 3 150 | 15 108 | 6 275 |
| Cash flow from financing activities | 41 013 | 3 150 | 62 376 | 6 275 |
| Cash flow for the period | -367 | -1 125 | -832 | -12 228 |
| Cash and cash equivalents at the beginning of the period | 1 791 | 3 381 | 2 256 | 14 484 |
| Cash and cash equivalents at the end of the period | 1 424 | 2 256 | 1 424 | 2 256 |
| Incl. unutilized credits | 2 508 | 35 506 | 2 508 | 35 506 |
Data per share
| Q4 | Q4 | FY | FY | |
| 2021/22 | 2020/21 | 2021/22 | 2020/21 | |
| Earnings per Share, SEK | -0.71 | -0.47 | -1.76 | -1.63 |
| Equity per share, SEK | 1.32* | 0.37 | 1.32* | 0.37 |
| Not registrated shares 31 of April | 6 057 729 | – | 6 057 729 | – |
| Number of Shares, end of period | 14 394 971 | 14 394 971 | 14 394 971 | 14 394 971 |
| Average number of shares | 14 394 971 | 14 394 971 | 14 394 971 | 14 394 971 |
| Share price end of period, SEK | 5.60 | 25.00 | 5.60 | 25.00 |
Parent company
Income statement (KSEK)
| Q4 | Q4 | FY | FY | |
| 2021/22 | 2020/21 | 2021/22 | 2020/21 | |
| Net sales | 1 566 | 1 405 | 6 437 | 2 991 |
| Cost of products sold | -535 | -676 | -2 417 | -1 358 |
| Gross profit | 1 031 | 729 | 4 020 | 1 633 |
| Gross margin | 66% | 52% | 62% | 55% |
| Selling expenses | -1 356 | -2 898 | -6 412 | -6 617 |
| Administrative expenses | -772 | -1 775 | -7 388 | -7 084 |
| R&D expenses | -2 806 | -2 571 | -8 817 | -11 720 |
| Other Income | 1 972 | |||
| Operating result (EBIT) | -3 903 | -6 515 | -18 597 | -21 816 |
| Financial net | -5 245 | -1132 | -5 557 | -1 137 |
| Result before tax (EBT) | -9 148 | -7 647 | -24 154 | -22 953 |
| Net Result (EAT) | -9 148 | -7 647 | -24 154 | -22 953 |
Balance sheet (KSEK)
| Q4 | FY | |
| 2021/22 | 2020/21 | |
| ASSETS | ||
| Non-current assets | ||
| Intangible assets | 17 038 | 14 823 |
| Tangible assets | 181 | 337 |
| Financial assets | 3 994 | |
| Total non-current assets | 21 213 | 15 160 |
| Current Assets | ||
| Inventory | 2 979 | 1 334 |
| Short-term receivables | 34 864 | 4 657 |
| Cash and equivalents | 721 | 1 711 |
| Total current assets | 38 564 | 7 702 |
| Total assets | 59 777 | 22 862 |
| EQUITY AND LIABILITIES | ||
| Equity | 29 513 | 6 399 |
| Financial liabilities | 22 380 | 7 400 |
| Operating liabilities | 7 884 | 9 063 |
| Total equity and liabilities | 59 777 | 22 862 |