Pre-study for Kinetic Motility Assay Protocol

For the optimal outcome of Kinetic Motility studies using HoloMonitor® App Suite, the settings for the duration, interval, and number of positions need to be selected carefully. This protocol shows how to calculate these parameters prior to setting up a motility study.
Please note that this procedure is based on the Kinetic Motility Assay, thus you will need a Kinetic Motility Assay Protocol.
BACKGROUND
When using HoloMonitor® for cell motility studies it is vital that the capture settings are optimized for each cell line. There are three parameters to consider: Duration, Interval, and Number of positions. Fast-moving cells need to be captured frequently in order to acquire a correct velocity estimate. They may also move out of the field of view. Therefore, fast-moving cells should be captured as often as every 1-5 minutes. Slow-moving cells can be captured every 6-20 minutes. As a guideline: between captures, a cell should have moved a distance that is a maximum of 40% of its diameter (1).
Too frequent capturing, however, limits the number of positions that can be included in the experiments due to the speed limitation of the HoloMonitor® M4 stage. On the other hand, at least 40 cells should be included in the experiment from the start, to get reliable statistics (1). The App Suite software calculates the time needed for the chosen settings and warns when the limitations are exceeded.
Duration must also be selected carefully. The duration should allow the cells to move on average 10 times the cell diameter, i.e. 1-2 hours for fast-moving cells and 12-36 hours for slow-moving cells. However, the more confluent the culture gets, the less will cells move, providing no additional relevant information about motility and potentially introducing artifacts. In addition, longer assays return more images and data files, requiring more storage and making it challenging to interpret the results. Hence, the duration of the capturing should be balanced between data quantity and quality. To be able to set up an experiment when the cell velocity is unknown, a 4-hour pre-study on untreated control cells is recommended.
In case cell diameter and velocity are known, go directly to the Calculation section.
PREPARATIONS
✓ Follow all steps in the Kinetic Motility Assay Protocol.
EXPERIMENT SETUP
Basic setup: describe the experiment and assign treatments/ conditions to the wells
✓ Follow all steps in the Kinetic Motility Assay Protocol.
Capture setup: Select the experiment time settings and choose capture positions
Adjust the default settings for the duration, interval, and number of positions.
►Set the Duration to 4 hours and Frequency to one image per 5 minutes.
►Set Positions per well to 1 in the selected well. In this step, the duration and interval of the experiment are set.
►Capture positions for imaging are selected and the image quality can be validated.
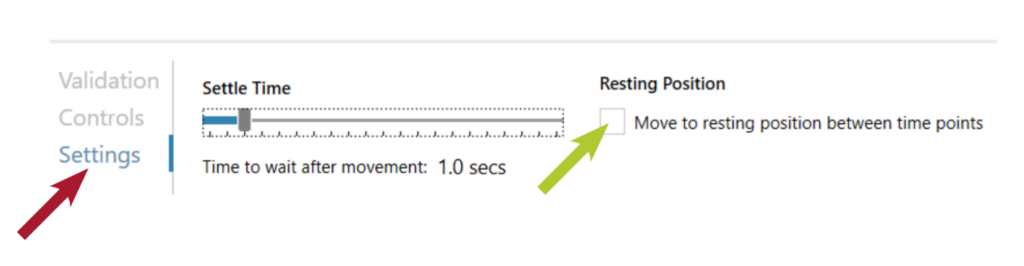
Click Settings (red arrow) and uncheck the box Move to resting position between time points (green arrow).
Ensure that the selected position is well-focused. To move the stage there, click on the small square in the selected well (depicting the position) in the well. Focus is adjusted in the Control tab, see the Setup and Operational Manual for details.
Start the capturing and close the experiment tab when finished, as described in the Kinetic Motility Assay Protocol.
Capture: Review the experiment in real-time during the time-lapse
✓ Follow all steps in the Kinetic Motility Assay Protocol.
RESULTS & ANALYSIS
✓ Follow all steps in the Kinetic Motility Assay Protocol.
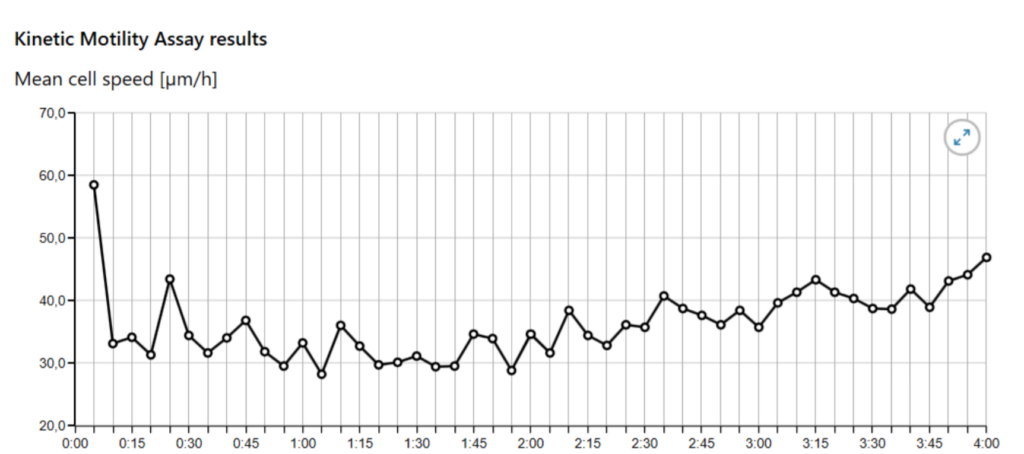
Follow the Kinetic Motility Assay Protocol until the Experiment result page and observe the graphs.
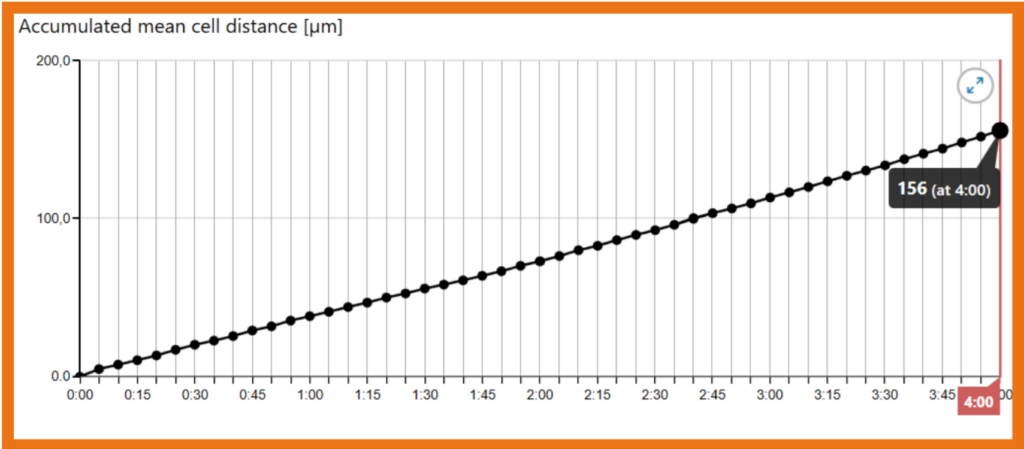
In the graph showing accumulated mean distance, the distance covered after 4 hours is seen by hovering the mouse pointer over the last data point on the time scale (X-axis). From this value, mean speed (µm/min) can be calculated as described in the Calculations steps below.
CALCULATIONS
Calculations for Optimal Capture Interval
The optimal capture interval is defined as the time it takes for the cells to move about 40% of their diameter, hence:
Optimal capture interval = 0.4 × cell diameter/cell velocity
The average cell diameter can be obtained using the HoloMonitor® Cell Quality Control Assay and the cell velocity is calculated from the accumulated distance graph as:
Cell velocity= mean distance / duration
Duration
The Calculationduration equals the time it takes for the cells to move 10 × their diameter:
Minimum duration= 10 × cell diameter/cell velocity
► The maximum duration, defined as the time point when the confluence reaches 70 %.
Number of positions
As many as needed to include at least 40 cells/treatment.
►Note that depending on the time for treatment to take effect, the duration may have to be extended. Just make sure that the confluence does not exceed 70 %.
Example
If the cells have moved 156 µm in 240 min, the cell velocity equals 156 µm/ 240 min = 0.65 µm/min.
Therefore, for an average cell diameter of 22.6 µm, the optimal capture interval is 0.4 x 22.6 / 0.65 = 13.9 minutes. The minimum duration is 10 x 22.5 / 0.65 = 348 minutes or 5h 48min.
References
- Roman Zantl and Elias Horn (2011) Chemotaxis of slow migrating mammalian cells analyzed by video microscopy, in Cell migration, developmental methods and protocols. Claire M. Wells and Maddy Parsons
(Ed.) ISBN: 978-1-61779 206-9, Humana Press c/o Springer Science, New York, USA