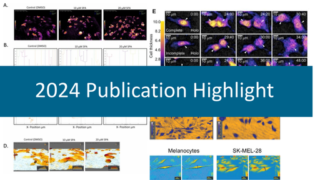
Succeed in tracking your cells
We at PHI are always happy to hear from you, our customers, and receive feedback and suggestions on improving your HoloMonitor® experience. Therefore, we are excited to say that we have focused on realizing many of your suggestions with the latest software update, resulting in a new and advanced Single Cell Tracking analysis. With this new update, we give you a state-of-the-art tool that automatically detects cell divisions and tracks all cells over time.
In other words: see for yourself!
What’s new?
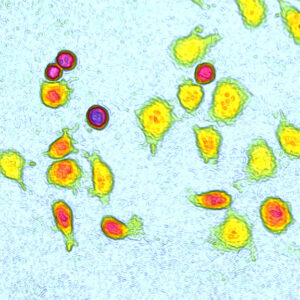
- Powerful algorithms cut down analysis time
- More automation for faster tracking adjustments
- Easy-to-navigate layout rebuilt on collected user input
- Improved data export based on your user feedback
- Easier data presentation in the software
Save valuable time with automatic Single Cell Tracking
In short, we have included the feedback and functionality requests from you – our users. The result is an easy-to-use software where you will get relevant results quicker! But the best thing about HoloMonitor is its core technology — digital holography. In fact, this enables the system to automatically collect data on each individual cell within the image, unlocking insights in tracking, cell behavioral, or morphological changes.
Further, this software update includes a new robust algorithm that tracks all cells with higher precision. In addition, the new algorithm is also better at detecting cell divisions and automatically assigning daughter cells to their cell family. As a result, you get insights into the entire family tree of a cell and that — thanks to digital holography — without any cellular markers
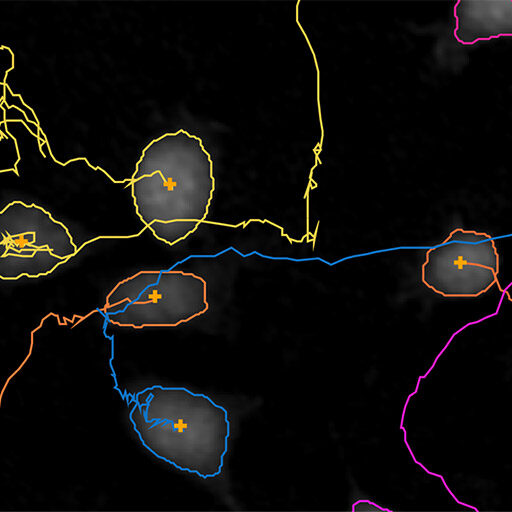
More automation for faster tracking adjustments
- New automated division-detection
Powerful algorithms cut down your analysis time
- Automatic tracking of all cells in the image
Analyze both cell movement and morphological changes
With HoloMonitor, you can follow how cells behave over time inside the incubator. Moreover, using only one sample, you can study multiple behavioral and morphological changes in your cell culture over time. And it is here where the latest Single Cell Tracking software will make you succeed! Above all, running a single experiment, you can see how cell movement plots change over time and at the same time study the changes in 30+ cell morphology features – both for single cells and the entire cell population.
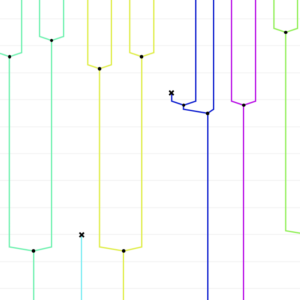
Easier data presentation in the software
- Grouping in cell families makes analysis easier
- *New* cell tree plot to follow cells and their daughters over time
Easy-to-navigate layout built on collected user input
- Bigger image viewer
- Better controls for manual correction of both cell tracks and cell identification
- Uniform colors across the software
Dive deeper into your results with improved data export
All the data from the Single Cell Tracking analysis can be exported as an XLSX file. Therefore, you can open and analyze the data further in Excel using your preferred methods. In addition, the export contains raw data for all morphological features, including cell area, volume, migration, and motility. Also, you can extract more information such as cell cycle length and tailor the result presentation from the raw data. However recently, we have worked a lot on enhancing the way data is presented in the export to improve your experience. For example, results are divided based on cell families and we added pre-made graphs showing all cell features, movement plots, and cell trees.
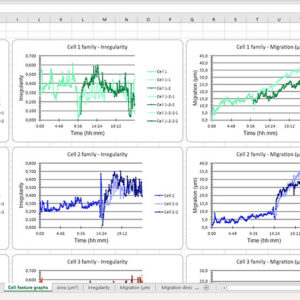
Improved data export based on your user feedback
- Refined look and structure of the Excel sheets
- Extra output parameters, e.g. cell family overviews and pre-made graphs

