Phase Holographic Imaging PHI AB (publ)
Lund, December 14, 2020
August 2020 – October 2020
| Net sales | 826 (888) KSEK |
| Operating result before depreciation (EBITDA) | -2 946 ( -4 879) KSEK |
| Net result | -4 777 (-6 761) KSEK |
| Earnings per share | -0.33 (-0.47) SEK |
| Gross margin | 77 (66) % |
May 2020 – October 2020
| Net sales | 957 (1 482) KSEK |
| Operating result before depreciation (EBITDA) | -7 495 ( -10 149) KSEK |
| Net result | -11 194 (-13 917) KSEK |
| Earnings per share | -0.78 (-0.97) SEK |
| Gross margin | 64 (63) % |
In short
- The relaxed COVID-19 restrictions during the 2nd quarter led to a noticeable increase in sales.
- Net sales (delivered orders) for the 2nd quarter including non-delivered signed orders amounted to 1.6 MSEK.
- The moderate restrictions during the 2nd quarter allowed travel for on-site demonstrations and evaluations, among others to Germany’s top pharmaceutical company.
- The transition to more resource-efficient online sales and marketing combined with financial support from the government has year-to-date resulted in a cost savings of approximately 3 MSEK.
CEO commentary
Net sales including outstanding orders amounted to 1.6 MSEK during August – October, a noticeably increase compared with the corresponding period in previous years. The brief pause of the pandemic during the fall allowed us to again travel for on-site demonstrations and evaluations, most notably to Germany’s top pharmaceutical company Bayer AG.
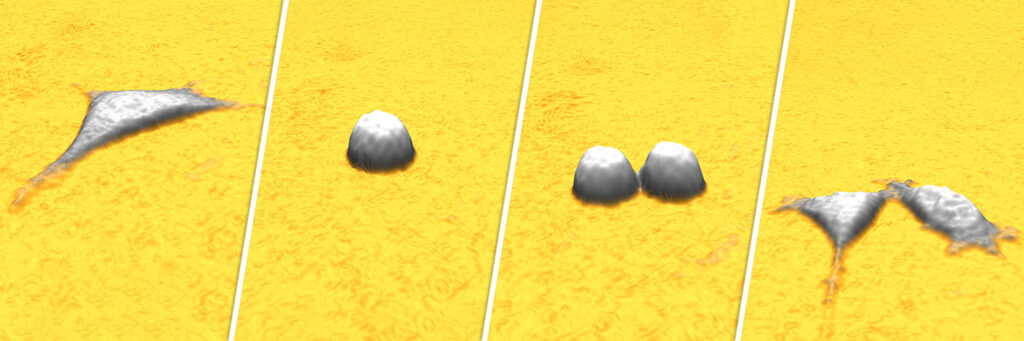
Stem Cells
Starting with HoloMonitor, the extensive evaluation by Bayer AG was planned to involve a number of instruments from various suppliers. But after just a few days, the laboratory at Bayer was closed due to the again rising spread of infection in Germany and consequently the researchers were sent home.
Fortunately, the few days of image recording turned out to be sufficient to evaluate HoloMonitor. After providing additional licenses for the HoloMonitor software, the Bayer scientists were delighted to be able to complete the data analysis from home on their laptops. HoloMonitor’s unique non-invasive functionality combined with the ability to work remotely prompted the Bayer researchers to immediately order a complete HoloMonitor system for their stem cell research.
Stem cells offer an enormous potential for medical research. See Stem cells – The new age of medical research to learn about stem cells and stem cell research at Bayer.
COVID focus
Bayer is by no means unique in taking the pandemic very seriously. In general, the life science industry is closed for non-COVID-related business. Amplified by current uncertainties and practical difficulties, the industry’s preoccupation with COVID has led to that everything from technical evaluations to company mergers has been put on hold.
This focus is understandable as the world’s future economy depend on the industry’s ability to develop a safe and effective vaccine that is sufficiently inexpensive and practical to allow mass vaccination of close to 8 billion people. The required speed and scale make this the largest healthcare effort in human history.
PHI Inc.
Since our Boston Massachusetts subsidiary became operational, the spread of infection has severely limited our ability to visit customers in the United States. However, the lower infection rate during the fall, with temporarily eased visit and travel restrictions as a result, allowed us to secure the first US orders since PHI Inc. became operational in March.
From humble beginnings in the 1950s, cell culturing is now making its way into the food industry. One of the US orders was placed by a company aiming to create lab-grown meat. Fat makes meat tasty. HoloMonitor allows the company’s scientists to non-destructively monitor and quantify the fat content in fat cells.
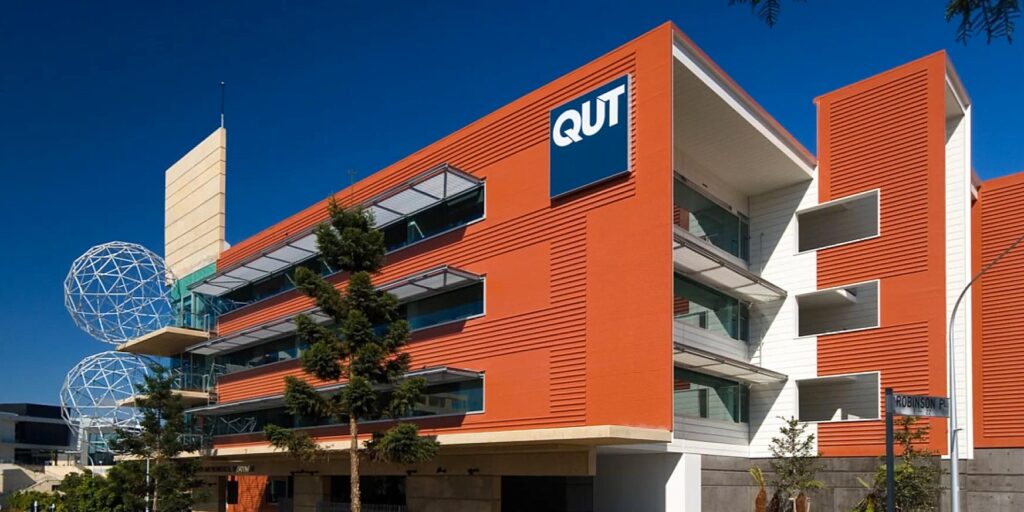
Two HoloMonitor systems became operational in October at Queensland University of Technology. The systems will enable researchers to investigate cells for drug development in the fields of cancer, infection and regenerative medicine.
Cost savings
The transition to more resource-efficient online sales and marketing together with financial support from the government has year-to-date resulted in a cost savings of approximately 3 MSEK.
Temporarily postponed sales
As we are seeing, sales will intermittent during the pandemic. However, sales are not lost; they are temporarily postponed.

There is reason to believe that the life science industry will emerge stronger than ever when it has delivered a vaccine to the world and return to combat and invest in the non-infectious diseases that continue to plague humanity. To come out on top when non-COVID investments resume, we will continue to improve our products and adapt our sales and marketing to the emerging online world post-COVID-19.
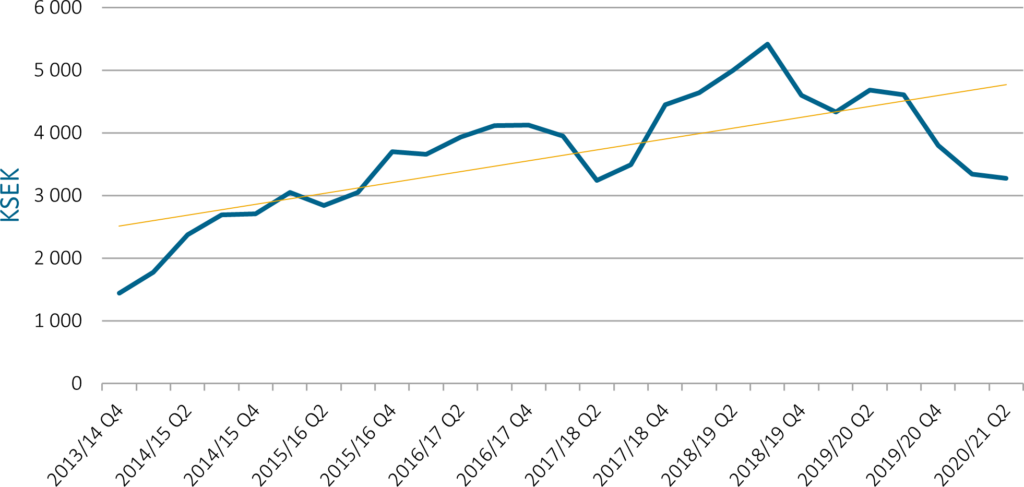
Rolling 12-month sales with trendline
Net sales and result
Net sales for the second quarter amounted to 826 (888) KSEK and operating result before depreciation (EBITDA) to -2 946 (-4 879) KSEK. Net result amounted to -4 777 (-6 761) KSEK.
Investments
During the period, the company invested 1 048 (617) KSEK in patents and product development.
Financing
Cash, cash equivalents and unutilized granted credits amounted to 21 595 (27 574) KSEK by the end of the period. The equity ratio was 62 (84) %.
Covid-19
PHI has received a loan facility to bridge the effects of the COVID-19 pandemic. The loan agreement between PHI and Danish Formue Nord Markedsneutral A/S allows PHI to call for loans totaling 15 MSEK at market terms. Together with additional support from the government, it is estimated that the PHI’s working capital is secured throughout 2021.
Risks
The company may be affected by various factors, described in the 2019/20 Annual Report. These factors may individually or jointly increase risks for the operation and result of the company.
Accounting principles
The accounts are prepared in accordance with the Annual Accounts Act and general advice from the Swedish Accounting Standards Board BFNAR 2012:1 Annual accounts and consolidated accounts (K3).
Review
This interim report has not been subject to review by the company’s auditor.
Statements about the future
Statements concerning the company’s business environment and the future in this report reflect the board of director’s current view of future events and financial developments. Forward-looking statements only express the judgments and assumptions made by the board of directors on the day of the report. These statements have been carefully assessed. However, it is brought to the reader’s attention that these statements are associated with uncertainty, like all statements about the future.
Calendar
March 16, 2021 Interim Report 3
On behalf of the Board of Directors
Peter Egelberg, CEO
For additional information please contact:
Peter Egelberg
Tel: +46 703 19 42 74
E-mail: ir@phiab.se
Web: www.phiab.com
Consolidated – PHI Group
Income statement (KSEK)
| Q2 | Q2 | YTD | YTD | FY | |
| 2020/21 | 2019/20 | 2020/21 | 2019/20 | 2019/20 | |
| Net sales | 826 | 888 | 957 | 1 482 | 3 803 |
| Cost of products sold | -190 | -302 | -347 | -554 | -1 500 |
| Gross profit | 636 | 586 | 610 | 928 | 2 303 |
| Gross margin | 77% | 66% | 64% | 63% | 61% |
| Selling expenses | -1 874 | -2 022 | -3 482 | -4 350 | -8 756 |
| Administrative expenses | -1 025 | -1 400 | -3 859 | -2 884 | -6 428 |
| R&D expenses | -3 041 | -3 884 | -6 161 | -7 525 | -13 538 |
| Operating income | 523 | 1 723 | 367 | ||
| Operating result (EBIT) | -4 781 | -6 720 | -11 169 | -13 831 | -26 052 |
| Financial net | 4 | -41 | -25 | -86 | -261 |
| Result before tax (EBT) | -4 777 | -6 761 | -11 194 | -13 917 | -26 313 |
| Net Result (EAT) | -4 777 | -6 761 | -11 194 | -13 917 | -26 313 |
Balance Sheet (KSEK)
| Q2 | Q2 | FY | |
| 2020/21 | 2019/20 | 2019/20 | |
| ASSETS | |||
| Non-current assets | |||
| Intangible assets | 14 954 | 18 358 | 16 735 |
| Tangible assets | 518 | 924 | 704 |
| Total non-current assets | 15 472 | 19 282 | 17 439 |
| Current Assets | |||
| Inventory | 1 604 | 1 151 | 1 530 |
| Short-term receivables | 2 981 | 2 869 | 2 590 |
| Cash and equivalents | 8 345 | 25 574 | 14 484 |
| Total current assets | 12 930 | 29 594 | 18 604 |
| Total assets | 28 402 | 48 876 | 36 043 |
| EQUITY AND LIABILITIES | |||
| Equity | 17 675 | 41 031 | 28 896 |
| Financial liabilities | 4 625 | 1 125 | 1 125 |
| Operating liabilities | 6 102 | 6 720 | 6 022 |
| Total equity and liabilities | 28 402 | 48 876 | 36 043 |
Changes in equity
| Q2 | Q2 | FY | |
| 2020/21 | 2019/20 | 2019/20 | |
| Opening Balance | 22 476 | 47 538 | 37 653 |
| Equity issues, net | 17 487 | ||
| Net profit | -4 777 | -6 761 | -26 313 |
| Translation difference | -24 | 254 | 69 |
| Closing balance | 17 675 | 41 031 | 28 896 |
| Equity ratio | 62% | 84% | 80% |
Cash flow Analysis (KSEK)
| Q2 | Q2 | YTD | YTD | FY | |
| 2020/21 | 2019/20 | 2020/21 | 2019/20 | 2019/20 | |
| Operating activities | |||||
| Net result | -4 777 | -6 761 | -11 194 | -13 917 | -26 313 |
| Depreciation | 1 835 | 1 841 | 3 674 | 3 682 | 7 360 |
| Translation difference | -24 | -27 | 79 | ||
| Operating cash flow | -2 966 | -4 920 | -7 547 | -10 235 | -18 896 |
| Increase (-)/decrease (+) in inventories | -211 | 323 | -74 | 231 | -148 |
| Increase (-)/decrease (+) in operating receivables | -824 | -438 | -470 | -373 | -88 |
| Increase (+)/decrease (-) in operating liabilities | -244 | -82 | 159 | -568 | -1 272 |
| Change in working capital | -1 279 | -197 | -385 | -710 | -1 508 |
| Cash flow from operating activities | -4 245 | -5 117 | -7 932 | -10 945 | -20 404 |
| Investing activities | |||||
| Development expenses | -1 048 | -617 | -1 707 | -1 153 | -2 729 |
| Patents | -204 | -204 | -266 | ||
| Tangible assets | -175 | ||||
| Cash flow after investments | -5 293 | -5 938 | -9 639 | -12 302 | -23 653 |
| Financing activities | |||||
| Net proceeds from equity issues | 254 | 17 295 | 17 487 | ||
| Increase (+)/decrease (-) in borrowings | -250 | -375 | 3 500 | -750 | -750 |
| Cash flow from financing activities | -250 | -121 | 3 500 | 16 545 | 16 737 |
| Cash flow for the period | -5 543 | -6 059 | -6 139 | 4 243 | -6 847 |
| Cash and cash equivalents at the beginning of the period | 13 888 | 31 633 | 14 484 | 21 331 | 21 331 |
| Cash and cash equivalents at the end of the period | 8 345 | 25 574 | 8 345 | 25 574 | 14 484 |
| Incl. unutilized credits | 21 595 | 27 574 | 21 595 | 27 574 | 16 484 |
Data per share
| Q2 | Q2 | YTD | YTD | FY | |
| 2020/21 | 2019/20 | 2020/21 | 2019/20 | 2019/20 | |
| Earnings per Share, SEK | -0.33 | -0.47 | -0.78 | -0.97 | -1.83 |
| Equity per share, SEK | 1.23 | 1.54 | 1.23 | 1.54 | 2.01 |
| Number of Shares, end of period | 14 394 971 | 14 379 154 | 14 394 971 | 14 379 154 | 14 394 971 |
| Average number of shares | 14 394 971 | 14 379 154 | 14 394 971 | 14 189 052 | 14 386 521 |
| Share price end of period | 27.60 | 59.00 | 27.60 | 59.00 | 36.40 |
Parent company
Income statement (KSEK)
| Q2 | Q2 | YTD | YTD | FY | |
| 2020/2021 | 2019/20 | 2020/21 | 2019/20 | 2019/20 | |
| Net sales | 1 015 | 801 | 1 137 | 1 395 | 3 716 |
| Cost of products sold | -424 | -162 | -581 | -554 | -1 502 |
| Gross profit | 591 | 639 | 556 | 841 | 2 214 |
| Gross margin | 58% | 80% | 49% | 60% | 60% |
| Selling expenses | -1 495 | -2 022 | -2 403 | -4 350 | -8 756 |
| Administrative expenses | -1 025 | -1 340 | -3 859 | -2 824 | -5 814 |
| R&D expenses | -3 041 | -4 024 | -6 161 | -7 525 | -13 538 |
| Other Income | 523 | 1 723 | 367 | ||
| Operating result (EBIT) | -4 447 | -6 747 | -10 144 | -13 858 | -25 527 |
| Financial net | 4 | -41 | -25 | -86 | -261 |
| Result before tax (EBT) | -4 443 | -6 788 | -10 169 | -13 944 | -25 788 |
| Net Result (EAT) | -4 443 | -6 788 | -10 169 | -13 944 | -25 788 |
Balance Sheet (KSEK)
| Q2 | Q2 | FY | |
| 2020/21 | 2019/20 | 2019/20 | |
| ASSETS | |||
| Non-current assets | |||
| Intangible assets | 14 954 | 18 358 | 16 735 |
| Tangible assets | 518 | 924 | 704 |
| Financial assets | 942 | 942 | 942 |
| Total non-current assets | 16 414 | 20 224 | 18 381 |
| Current Assets | |||
| Inventory | 1 337 | 1 151 | 1 530 |
| Short-term receivables | 4 067 | 2 791 | 2 648 |
| Cash and equivalents | 7 998 | 24 669 | 13 940 |
| Total current assets | 13 402 | 28 611 | 18 118 |
| Total assets | 29 816 | 48 835 | 36 499 |
| EQUITY AND LIABILITIES | |||
| Equity | 19 183 | 40 750 | 29 352 |
| Financial liabilities | 4 625 | 1 125 | 1 125 |
| Operating liabilities | 6 008 | 6 960 | 6 022 |
| Total equity and liabilities | 29 816 | 48 835 | 36 499 |