Interim Report 1 2022/23
Phase Holographic Imaging PHI AB (publ)
Lund, September 29, 2022
May 2022 – July 2022
| Net sales | 2 035 (2 373) KSEK |
| Operating result before depreciation (EBITDA) | -4 848 (-3 439) KSEK |
| Net result | -5 753 (-4 469) KSEK |
| Earnings per share | -0.28 (-0.31) SEK |
| Gross margin | 45 (60) % |
In Short
- Despite a summer-sluggish period ending in July, sales were just one unit away from surpassing our best quarter ever; the same period last year.
- Customer inquiries rebounded in September to a level not previously experienced.
- Deliveries of the fluorescence module will begin during the autumn.
- PHI and other companies associated with the Wake Forest Institute for Regenerative Medicine have come together to create the new quality standards and analytical tools needed to manufacture safe, effective and affordable regenerative therapies.
CEO Commentary
Sales
Customer inquiries dropped sharply during the latter part of the period (May through July) to rebound during September to a level we have not experienced previously. The sharp rise and volume of online inquiries and demonstrations confirm the effectiveness of digital sales and marketing strategy.
Despite a summer-sluggish period ending in July, sales were just one unit away from surpassing our best quarter ever; the same period last year. However, the interest in the HoloMonitor fluorescence module remained noticeably high over the summer. During the autumn, fluorescence modules will be delivered to current customers who have expressed great interest in combining holography with fluorescence.
Fluorescence imaging allows the genetic activity of cells to be characterized and is, therefore, an indispensable tool in medical research. However, in contrast to holographic microscopy, fluorescence imaging involves adding a reagent to the cells, which releases toxins each time the cells are imaged.
HoloMonitor’s fluorescence module seamlessly combines fluorescence microscopy with reagent-free holographic microscopy. As the two microscopy techniques are integrated into a single unit, fluorescence imaging can be turned on only when needed, reducing the release of toxins to a minimum.
Business Development
Standardizing Regenerative Medicine
Since HoloMonitor operates inside a cell incubator, combining fluorescence and holographic microscopy transforms HoloMonitor into an unprecedentedly versatile analytical tool emphasizing ease of use and cell quality. The versatility of HoloMonitor makes it valuable not only in medical research but also when manufacturing regenerative therapies where cell quality is critical.
Regenerative medicine therapies cure patients with previously untreatable and life-threatening diseases using laboratory cultured cells, tissue or organs. The success of these “miracle cures” have led to a flood of investments. According to the 2021 annual report of the Alliance for Regenerative Medicine, 73 billion USD was invested in developing new or improved regenerative therapies during 2017 – 2021.
The US and European medicines agencies have recognized that current standards and commercially available cell culturing tools are inadequate for large-scale manufacturing of regenerative therapies. For example, the industry struggles with the most basic measurement — counting cells. The current cell counting methods are good enough for pre-clinical research but not for clinical manufacturing purposes where human lives are at stake.
Consequently, commercial regenerative therapies can cost several hundred thousand USD per treatment, excluding all hospital costs. To advance therapy manufacturing and thereby reduce costs, the US and European medicines agencies have called for new standards and manufacturing tools to solve the manufacturing problem and meet the growing demand for affordable regenerative therapies.
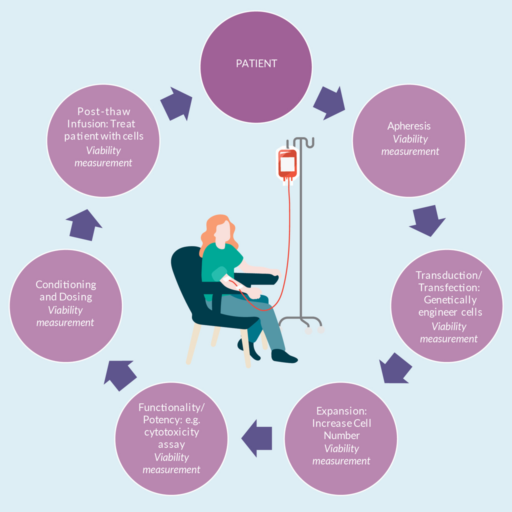
In the midst of this, we find ourselves having a vital part of the solution by simply adapting our HoloMonitor technology to large-scale therapy manufacturing. Unlike current standards, HoloMonitor can count the number of living and dead cells, known as cell viability, without adding any reagents. The adaptation of HoloMonitor would allow therapies to be continuously monitored, not only during manufacturing but also throughout the entire treatment chain, as shown in the above image.

Since our visit to Wake Forest Institute for Regenerative Medicine in August, PHI and other companies associated with the institute have come together. The goal is to create the quality standards and analytical tools needed to manufacture safe and effective regenerative therapies at a cost that would allow millions of patients to be cured of diseases that are untreatable today.
Net Sales and Result
Net sales for the first quarter amounted to 2 035 (2 373) KSEK and operating results before depreciation (EBITDA) to -4 848 (-3 439) KSEK. The net result amounted to -5 753 (-4 469) KSEK.
Rolling 12-month Sales
Investments
With an emphasis on regenerative medicine and the development of fluorescence capability, the company invested 1 266 (1 501) KSEK in the product, patent, and application development during the period.
Financing
Cash, cash equivalents, and unutilized granted credits amounted to 28 553 (28 167) KSEK by the end of the period. The equity ratio was 52 (3) %.
In connection with the rights issue being registered, PHI received 32.2 MSEK after issuing costs and repayment of loans to Formue A/S.
Rights issue
The rights issue, which ended on April 13, 2022, was subscribed for a total of approximately 57 MSEK, corresponding to a total subscription ratio of 80 %. Through the rights issue, a total of 6 057 729 shares and 3 365 405 new series of series TO 3 and 1 346 162 warrants of series TO 4 will be newly issued. PHI thus received approximately 57 MSEK before issue costs. As of May 12, 2022, the number of shares in PHI amounts to 20 452 700 with a share capital of 4 090 540 SEK.
Warrants of series TO 3
Each warrant of series TO 3 entitles to subscribe for one (1) new share in PHI during the period from 11 April 2023 to 2 May 2023. The exercise price amounts to 70 % of the volume-weighted average price during a period prior to option redemption, within the interval 0.20 SEK (the company’s quota value) as the lowest, and with 11.90 SEK per new share as the highest exercise price. Upon full exercise of warrants of series TO 3 at the highest exercise price (11.90 SEK per new share), the warrants will provide the company with approximately 40 MSEK before issue costs.
Warrants of series TO 4
Each warrant of series TO 4 entitles to subscribe for one (1) new share in PHI during the period from and including 12 September 2024 to and including 3 October 2024. The exercise price amounts to 70 % of the volume-weighted average price during a period prior to option redemption, within the interval 0.20 SEK as the lowest, and with 15.45 SEK per new share as the highest exercise price. Upon full exercise of warrants of series TO 4 at the highest exercise price (15.45 SEK per new share), the warrants will provide the company with approximately 20.8 MSEK before issue costs.
Convertibles
The convertible loan to Formue Nord Fokus A/S amounts to 20 230 000 SEK with the following terms:
- Number of convertibles: 1 700 000 convertibles, which entails the right to subscribe for 1 700 000 new shares.
- Conversion rates: 11.90 SEK per new share until 2 May 2023 (last day in the exercise period for warrants of series TO 3) and 15.45 SEK per new share from May 3, 2023, until October 16, 2024.
- Conversion period: the convertible holder is entitled during the period from the date of payment to October 16 2024 to convert the loan into shares.
- Maturity: in the event that the entire loan is not converted, repayment of the loan and interest must take place no later than October 16, 2024. The company has the right to repay all or part of the convertible loan at any time until the due date, after which Formue Nord has the opportunity to accept repayment or request conversion according to the above conversion rates.
- Interest: the convertibles run at a quarterly interest rate of 3%.
Risks
The company may be affected by various factors, described in the 2020/21 Annual Report. These factors may individually or jointly increase risks for the operation and result of the company.
Accounting Principles
The accounts are prepared in accordance with the Annual Accounts Act and general advice from the Swedish Accounting Standards Board BFNAR 2012:1 Annual accounts and consolidated accounts (K3).
Review
This interim report has not been subject to review by the company’s auditor.
Statements About the Future
Statements concerning the company’s business environment and the future in this report reflect the board of director’s current view of future events and financial developments. Forward-looking statements only express the judgments and assumptions made by the board of directors on the day of the report. These statements have been carefully assessed. However, it is brought to the reader’s attention that these statements are associated with uncertainty, like all statements about the future.
Calendar
- October 31, 2022, Annual General Meeting
- December 21, 2022, Interim Report 2 2022/23
About PHI
Phase Holographic Imaging (PHI) develops and markets instrumentation for non-invasive time-lapse imaging. The company’s HoloMonitor product line is used for long-term quantitative analysis of living cell cultures, particularly in preclinical research and regenerative medicine. PHI is based in Lund, Sweden and Boston, Massachusetts.
On behalf of the Board of Directors
Peter Egelberg, CEO
For additional information please contact:
Peter Egelberg
Tel: +46 703 19 42 74
E-mail: ir@phiab.se
Web: www.phiab.com
Consolidated – PHI Group
Income statement (KSEK)
| Q1 | Q1 | FY | |
| 2022/23 | 2021/22 | 2021/22 | |
| Net sales | 2 035 | 2 373 | 8 169 |
| Cost of products sold | -1 114 | -943 | -2 485 |
| Gross profit | 921 | 1 430 | 5 684 |
| Gross margin | 45% | 60% | 70% |
| Selling expenses | -3 078 | -2 070 | -9 303 |
| Administrative expenses | -1 817 | -2 057 | -7 388 |
| R&D expenses | -1 699 | -1 670 | -8 817 |
| Operating result (EBIT) | -5 673 | -4 367 | -19 824 |
| Financial net | -80 | -102 | -5 557 |
| Result before tax (EBT) | -5 753 | -4 469 | -25 381 |
| Net Result (EAT) | -5 753 | -4 469 | -25 381 |
Balance sheet (KSEK)
| Q1 | Q1 | FY | |
| 2022/23 | 2021/22 | 2021/22 | |
| ASSETS | |||
| Non-current assets | |||
| Intangible assets | 17 456 | 15 374 | 17 038 |
| Tangible assets | 164 | 286 | 181 |
| Total non-current assets | 17 620 | 15 660 | 17 219 |
| Current Assets | |||
| Inventory | 3 998 | 1 609 | 2 979 |
| Short-term receivables | 2 600 | 3 558 | 35 792 |
| Cash and equivalents | 26 553 | 6 167 | 1 424 |
| Total current assets | 33 151 | 11 334 | 40 195 |
| Total assets | 50 771 | 26 994 | 57 414 |
| EQUITY AND LIABILITIES | |||
| Equity | 21 134 | 893 | 26 983 |
| Financial liabilities | 22 663 | 18 658 | 22 508 |
| Operating liabilities | 6 974 | 7 443 | 7 923 |
| Total equity and liabilities | 50 771 | 26 994 | 57 414 |
Changes in equity (KSEK)
| Q1 | Q1 | FY | |
| 2022/23 | 2021/22 | 2021/22 | |
| Opening Balance | 26 983 | 5 384 | 5 384 |
| Equity issues, net | 47 268 | ||
| Net profit | -5 753 | -4 469 | -25 381 |
| Translation difference | -96 | -22 | -288 |
| Closing balance | 21 134 | 893 | 26 983 |
| Equity ratio | 42% | 3% | 47% |
Cash flow analysis (KSEK)
| Q1 | Q1 | FY | |
| 2022/23 | 2021/22 | 2021/22 | |
| Operating activities | |||
| Net result | -5 753 | -4 469 | -25 382 |
| Depreciation | 905 | 1 001 | 4 854 |
| Translation difference | -136 | -22 | -491 |
| Operating cash flow | -4 984 | -3 490 | -21 019 |
| Increase (-)/decrease (+) in inventories | -1 019 | -275 | -1 645 |
| Increase (-)/decrease (+) in operating receivables | 33 192 | -620 | -32 854 |
| Increase (+)/decrease (-) in operating liabilities | -949 | -1 461 | -981 |
| Change in working capital | 31 224 | -2 356 | -35 480 |
| Cash flow from operating activities | 26 240 | -5 846 | -16 335 |
| Investing activities | |||
| Development expenses | -1 266 | -1 501 | -6 539 |
| Patents | -170 | ||
| Tangible assets | |||
| Cash flow after investments | 24 974 | -7 347 | -63 208 |
| Financing activities | |||
| Net proceeds from equity issues | 47 268 | ||
| Increase (+)/decrease (-) in borrowings | 155 | 11 258 | 15 108 |
| Cash flow from financing activities | 155 | 11 258 | 62 376 |
| Cash flow for the period | 25 129 | 3 911 | -832 |
| Cash and cash equivalents at the beginning of the period | 1 424 | 2 256 | 2 256 |
| Cash and cash equivalents at the end of the period | 26 553 | 6 167 | 1 424 |
| Incl. unutilized credits | 28 553 | 28 167 | 2 508 |
Data per share
| Q1 | Q1 | FY | |
| 2022/23 | 2021/22 | 2021/22 | |
| Earnings per Share, SEK | -0.28 | -0.31 | -1.76 |
| Equity per share, SEK | 0.26 | 0.06 | 1.32* |
| Not registrated shares 31 of April ,2022 | 6 057 729 | ||
| Number of Shares, end of period | 20 452 700 | 14 394 971 | 14 394 971 |
| Average number of shares | 20 452 700 | 14 394 971 | 14 394 971 |
| Share price end of period, SEK | 4.44 | 28.45 | 5.60 |
Parent company
Income statement (KSEK)
| Q1 | Q1 | FY | |
| 2022/23 | 2021/22 | 2021/22 | |
| Net sales | 1 846 | 1 822 | 6 437 |
| Cost of products sold | -1 076 | -925 | -2 417 |
| Gross profit | 770 | 897 | 4 020 |
| Gross margin | 42% | 49% | 62% |
| Selling expenses | -2 127 | -1 419 | -6 412 |
| Administrative expenses | -1 817 | -2 057 | -7 388 |
| R&D expenses | -1 699 | -1 670 | -8 817 |
| Operating result (EBIT) | -4 873 | -4 249 | -18 597 |
| Financial net | -80 | -102 | -5 557 |
| Result before tax (EBT) | -4 953 | -4 351 | -24 154 |
| Net Result (EAT) | -4 953 | -4 351 | -24 154 |
Balance sheet (KSEK)
| Q1 | Q1 | FY | |
| 2022/23 | 2021/22 | 2021/22 | |
| ASSETS | |||
| Non-current assets | |||
| Intangible assets | 17 456 | 15 374 | 17 038 |
| Tangible assets | 164 | 286 | 181 |
| Financial assets | 3 994 | ||
| Total non-current assets | 17 620 | 15 660 | 21 213 |
| Current Assets | |||
| Inventory | 3 623 | 1 609 | 2 979 |
| Short-term receivables | 6 138 | 5 552 | 34 864 |
| Cash and equivalents | 26 249 | 5 320 | 721 |
| Total current assets | 36 010 | 12 481 | 38 564 |
| Total assets | 53 630 | 28 141 | 59 777 |
| EQUITY AND LIABILITIES | |||
| Equity | 24 560 | 2 048 | 29 513 |
| Financial liabilities | 22 380 | 18 650 | 22 380 |
| Operating liabilities | 6 690 | 7 443 | 7 884 |
| Total equity and liabilities | 53 630 | 28 141 | 59 777 |