Interim Report 1 2023/24
Phase Holographic Imaging PHI AB (publ)
Lund, September 20, 2023
MAY 2023 – JULY 2023
| Net sales | 2 726 (2 035) KSEK |
| Operating result before depreciation (EBITDA) | -2 693 (-4 848) KSEK |
| Net result | -4 299 (-5 753) KSEK |
| Earnings per share | -0.19 (-0.28) SEK |
| Gross margin | 76 (45) % |
In Short
- Our Q1 sales outperformed any previous Q1 period.
- The new HoloMonitor M4FL has its initial customers in the EU and the US.
- To promote HoloMonitor technology as a standard for cell quality control, PHI has joined the Alliance for Regenerative Medicine and ATMP Sweden stakeholder organizations.
- In the GlycoImaging project, we await the finalization of our EU patent.
- We doubled down on advocating for Quantitative Phase Imaging (QPI) as the industry standard for cell quality control in regenerative medicine.
CEO Commentary
Sales and Marketing
During this past summer quarter, we made it our most prosperous Q1 quarter to date, characterized by sustained growth. As part of our ongoing transformation strategy, we are strategically transitioning sales operations to our distributor network. This allows us to concentrate on PHI’s core business: developing innovative HoloMonitor products for regenerative medicine and other clinical applications.
A noteworthy achievement was the successful launch of our HoloMonitor M4FL product, which made its debut at the 2023 Annual Congress of the European Association for Cancer Research (EACR 2023) in Torino, Italy, and in the same week at the thought-leading International Society for Stem Cell Research 2023 Annual Meeting (ISSCR 2023) in Boston, Massachusetts. This summer also afforded our development team valuable time for conducting final tests and fine-tuning processes, collaborating closely with our supplier and first users to ensure the timely delivery of pre-series production units for autumn. We have diligently prepared an ample inventory of systems for sales this year. Now, the new HoloMonitor M4FL has its first customers in the EU and the US. With promising discussions and demonstrations following our summer conferences and September initiatives, we’re optimistic as we look ahead to the coming quarters.
Business Development
Regenerative Medicine
We aim to lead the widespread adoption of HoloMonitor and quantitative phase imaging as the standard for cell quality control in regenerative medicine. Fortunately, the stakeholder organizations we have joined to achieve the objective are well-defined internationally and locally in Sweden. The Alliance for Regenerative Medicine is a well-recognized international organization for cell-based therapy developers, regulators and technology developers. In October, PHI is invited to a senior-level networking regarding Cell & Gene Meeting in Carlsbad, California. ATMP Sweden is a national counterpart promoting patient access to safe and effective medicines based on recombinant genes, live cells and/or tissue engineering. This new class of regenerative medicines is classified as Advanced Therapy Medicinal Products (ATMPs) by the European Medicines Agency.
Simultaneously, our dedicated biomedical engineer stationed at the Wake Forest Institute for Regenerative Medicine (WFIRM) in Winston-Salem has diligently conducted live cell experiments and facilitated collaborative efforts with our valued ReMDO partners. Our alliance with SAS, QIAGEN and BioSpherix to advance cell-based biomanufacturing remains vibrant, marked by regular meetings and substantial progress. We’re proud to share that this collaboration has secured a ReMDO grant, a testament to the support for our ongoing initiatives and our unwavering commitment to progress.
Quality Control System
The process of achieving Good Manufacturing Practice (GMP) compliance continues. The first step in the process is to implement a company-wide quality control system. GMP compliance is essential for us as regulators require that our customers — cell therapy manufacturers — comply with GMP.
These developments underscore our commitment to advancing technology and driving innovation in regenerative medicine. I look forward to walking with you on this promising path for PHI.

The Greater Perspective
Slow AI makes the impossible possible
For the first time, low-cost computers are sufficiently powerful to allow in-process quality assessment using microscopy.
Despite the current hype and its usefulness in medicine and other areas, artificial intelligence (AI) is nothing more than a slow-learning idiot compared to a child.
After just seeing a few examples of cats and dogs, a 3-year-old can easily tell you whether a pet is a cat or a dog. Breed or point of view does not matter. The toddler will always get it right. On the contrary, AI needs to learn from thousands upon thousands of cat and dog images of all breeds from all possible points of view to “understand” the difference.
Nevertheless, AI’s slow learning, even on supercomputers, has led to the development of specialized low-cost computer technology that rapidly computes the sum of many multiplications. The maker of most laptop processors recently released a processor specifically designed for AI, which Intel promotes through a collaboration with the European Organization for Nuclear Research, CERN.
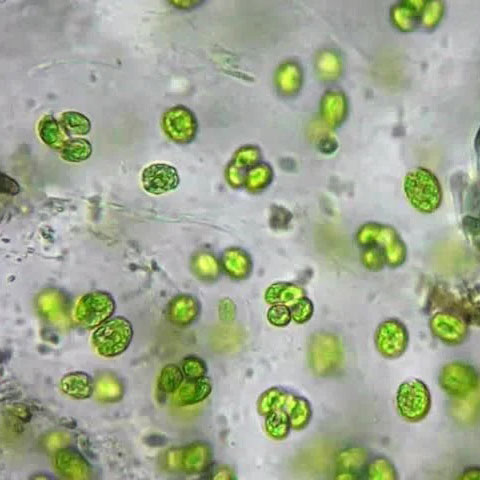
Incidentally, fast multiplications and additions are precisely what is needed to make microscopy practical and useful outside the laboratory. The narrow focal depth of a few micrometers (right image) makes conventional microscopy impractical in non-laboratory environments.
Unlike conventional microscopy, quantitative phase imaging (QPI) records a hologram from which the final image is numerically created and focused, as exemplified in the panel below. The QPI focal distance is thus set when viewing the image, not when the image is recorded as in conventional microscopy and photography.
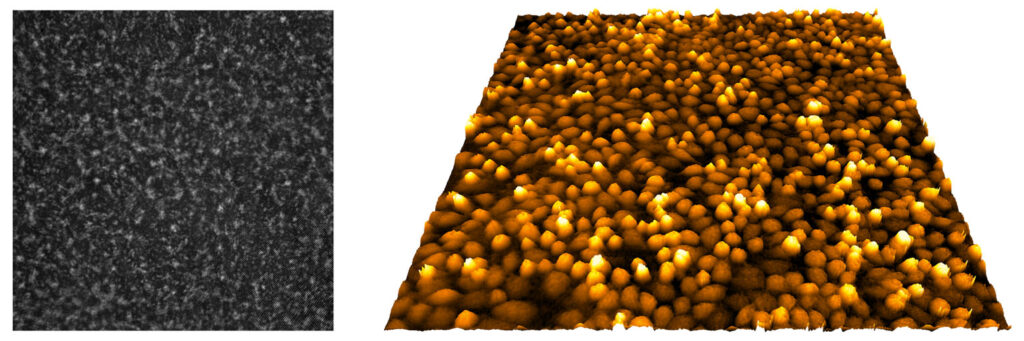
Like normal imaging, standard QPI requires that the focal plane is parallel to the image sensor. However, the fast processors developed for AI make it possible to use QPI algorithms that can focus objects on an inclined plane or even on a curved surface. In fact, such algorithms can focus objects wherever they happen to be in the depth direction. The ability to focus microscopic objects individually in a single recording is exactly what is needed for microscopy to become practical in non-laboratory environments.
Thanks to AI’s sluggishness, the previously impossible is now possible. For the first time, low-cost computers are sufficiently powerful to allow in-process quality assessment using QPI-based microscopy.
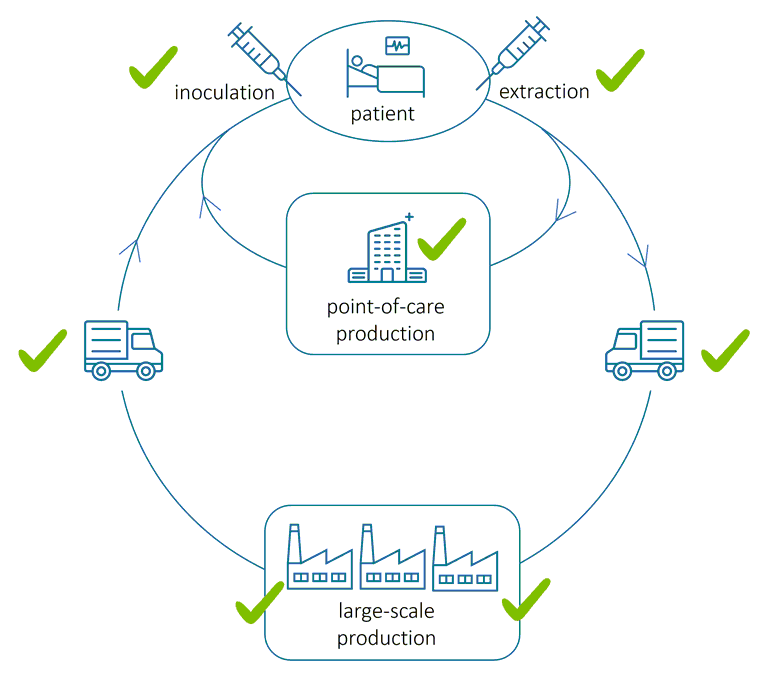
In regenerative medicine, the quality of cell-based therapies can thus be determined throughout the treatment cycle — during cell extraction, in therapy production, before treatment and possibly during therapy transportation.
Additional Reading
Net Sales and Result
Net sales for the first quarter amounted to 2 726 (2 035) KSEK and operating results before depreciation (EBITDA) to -2 693 (-4 848) KSEK. The net result amounted to -4 299 (-5 753) KSEK.

Investments
With an emphasis on regenerative medicine and the development of fluorescence capability, the company invested 2 240 (1 266) KSEK in the product, patent, and application development during the period.
Financing
Cash, cash equivalents, and unutilized granted credits amounted to 5 416 (28 553) KSEK by the end of the period. The equity ratio was 27 (42) %.
Warrants of series TO 3
On 2 May 2023, the exercise period for warrants of series TO 3 (“TO 3”), which were issued in connection with Phase Holographic Imaging PHI AB’s (“PHI” or the “Company”) rights issue of units that were announced on 22 February 2022, ended. 3 201 739 warrants of series TO 3 were exercised, corresponding to a subscription ratio of approximately 95.1 percent. Thus, the underwriting commitment relating to TO 3, which the Company agreed on during the exercise period, was activated. The decision on a directed share issue of 163 666 shares, corresponding to the remaining approximately 4.9 percent of the warrant exercise, to the underwriter Altium SA (“Altium”) was taken, with the support of the authorization given by the annual general meeting held on 31 October 2022. The proceeds of the TO 3 warrants amount to approximately SEK 12.7 million before the deduction of transaction-related costs, corresponding to a subscription rate of 100 percent.
Warrants of series TO 4
Each warrant of series TO 4 entitles to subscribe for one (1) new share in PHI during the period from and including 12 September 2024 to and including 3 October 2024. The exercise price amounts to 70 % of the volume-weighted average price during a period prior to option redemption, within the interval 0.20 SEK as the lowest, and with 15.45 SEK per new share as the highest exercise price. Upon full exercise of warrants of series TO 4 at the highest exercise price (15.45 SEK per new share), the warrants will provide the company with approximately 20.8 MSEK before issue costs.
Convertibles
The convertible loan to Formue Nord Fokus A/S amounts to 20 230 000 SEK with the following terms:
- Number of convertibles: 1 700 000 convertibles, which entails the right to subscribe for 1 700 000 new shares.
- Conversion rates: 11.90 SEK per new share until 2 May 2023 (last day in the exercise period for warrants of series TO 3) and 15.45 SEK per new share from May 3, 2023, until October 16, 2024.
- Conversion period: the convertible holder is entitled during the period from the date of payment to October 16 2024 to convert the loan into shares.
- Maturity: in the event that the entire loan is not converted, repayment of the loan and interest must take place no later than October 16, 2024. The company has the right to repay all or part of the convertible loan at any time until the due date, after which Formue Nord has the opportunity to accept repayment or request conversion according to the above conversion rates.
- Interest: the convertibles run at a quarterly interest rate of 3%.
Dilution of shares
| Total shares April 30, 2023 | 20 452 700 |
| TO 3 (April 2023, registered at Bolagsverket May 2023) | 3 365 405 |
| TO 4 (September 2024) | 1 346 162 |
| Convertibles | 1 700 000 |
| TOTAL | 26 864 267 |
Risks
The company may be affected by various factors, described in the 2021/22 Annual Report. These factors may individually or jointly increase risks for the operation and result of the company.
Accounting Principles
The accounts are prepared in accordance with the Annual Accounts Act and general advice from the Swedish Accounting Standards Board BFNAR 2012:1 Annual accounts and consolidated accounts (K3).
Review
This interim report has not been subject to review by the company’s auditor.
Statements About the Future
Statements concerning the company’s business environment and the future in this report reflect the board of director’s current view of future events and financial developments. Forward-looking statements only express the judgments and assumptions made by the board of directors on the day of the report. These statements have been carefully assessed. However, it is brought to the reader’s attention that these statements are associated with uncertainty, like all statements about the future.
Calendar
- End of September: Publication of annual report which will be available in our office in Lund and on www.phiab.com
- 27th of October: Annual general meeting in Lund
- 21st of December 2023, Interim Report 2 2023/24
About PHI
Phase Holographic Imaging (PHI) develops and markets instrumentation for non-invasive time-lapse imaging. The company’s HoloMonitor product line is used for long-term quantitative analysis of living cell cultures, particularly in preclinical research and regenerative medicine. PHI is based in Lund, Sweden and Boston, Massachusetts.
On behalf of the Board of Directors
Patrik Eschricht, CEO
For additional information, please contact:
Patrik Eschricht
Tel: +46 702 69 99 61
E-mail: ir@phiab.se
Web: www.phiab.com
Consolidated – PHI Group
Income statement (KSEK)
| Q1 | Q1 | FY | |
| 2023/24 | 2022/23 | 2022/23 | |
| Net sales | 2 726 | 2 035 | 9 900 |
| Cost of products sold | -665 | -1 114 | -4 832 |
| Gross profit | 2 061 | 921 | 5 068 |
| Gross margin | 76% | 45% | 51% |
| Selling expenses | -2 772 | -3 078 | -10 468 |
| Administrative expenses | -1 118 | -1 817 | -8 170 |
| R&D expenses | -1 732 | -1 699 | -6 782 |
| Operating result (EBIT) | -3 561 | -5 673 | -20 352 |
| Financial net | -738 | -80 | -2 833 |
| Result before tax (EBT) | -4 299 | -5 753 | -23 185 |
| Net Result (EAT) | -4 299 | -5 753 | -23 185 |
Balance sheet (KSEK)
| Q1 | Q1 | FY | |
| 2023/24 | 2022/23 | 2022/23 | |
| ASSETS | |||
| Non-current assets | |||
| Intangible assets | 21 068 | 17 456 | 19 654 |
| Tangible assets | 565 | 164 | 608 |
| Total non-current assets | 21 658 | 17 620 | 20 262 |
| Current Assets | |||
| Inventory | 4 353 | 3 998 | 3 846 |
| Short-term receivables | 12 091 | 2 600 | 5 293 |
| Cash and equivalents | 3 416 | 26 553 | 5 308 |
| Total current assets | 19 860 | 33 151 | 14 447 |
| Total assets | 41 518 | 50 771 | 34 709 |
| EQUITY AND LIABILITIES | |||
| Equity | 11 398 | 21 134 | 3 728 |
| Financial liabilities | 20 580 | 22 663 | 20 580 |
| Operating liabilities | 9 540 | 6 974 | 10 401 |
| Total equity and liabilities | 41 518 | 50 771 | 34 709 |
Changes in equity (KSEK)
| Q1 | Q1 | FY | |
| 2023/24 | 2022/23 | 2022/23 | |
| Opening Balance | 3 728 | 26 983 | 26 983 |
| Equity issues, net | 12 120 | 0 | 0 |
| Net profit | -4 299 | -5 753 | -23 185 |
| Translation difference | -151 | -96 | -70 |
| Closing balance | 11 398 | 21 134 | 3 728 |
| Equity ratio | 27% | 42% | 11% |
Cash flow analysis (KSEK)
| Q1 | Q1 | FY | |
| 2023/24 | 2022/23 | 2022/23 | |
| Operating activities | |||
| Net result | -4 299 | -5 753 | -23 185 |
| Depreciation | 869 | 905 | 3 486 |
| Translation difference | 0 | -136 | -70 |
| Realisationsresultat anläggningstillgångar | 0 | 0 | 125 |
| Operating cash flow | -3 429 | -4 984 | -19 644 |
| Increase (-)/decrease (+) in inventories | -507 | -1 019 | -867 |
| Increase (-)/decrease (+) in operating receivables | -6 669 | 33 192 | 30 639 |
| Increase (+)/decrease (-) in operating liabilities | -989 | -949 | 3 211 |
| Change in working capital | -8 165 | 31 224 | 32 983 |
| Cash flow from operating activities | -11 594 | 26 240 | 13 339 |
| Investing activities | |||
| Development expenses | -2 240 | -1 266 | -5 938 |
| Patents | 0 | 0 | -179 |
| Investment subsidiary | -25 | 0 | 0 |
| Tangible assets | 0 | 0 | -538 |
| Cash flow after investments | -13 859 | 24 974 | 6 684 |
| Financing activities | |||
| Net proceeds from equity issues | 11 968 | 0 | 0 |
| Increase (+)/decrease (-) in borrowings | 0 | 155 | -2 801 |
| Cash flow from financing activities | 11 968 | 155 | -2 801 |
| Cash flow for the period | -1 891 | 25 129 | 3 883 |
| Cash and cash equivalents at the beginning of the period | 5 307 | 1 424 | 1 424 |
| Cash and cash equivalents at the end of the period | 3 416 | 26 553 | 5 308 |
| Incl. unutilized credits | 5 416 | 28 553 | 7 308 |
Data per share
| Q1 | Q1 | FY | |
| 2023/24 | 2022/23 | 2022/23 | |
| Earnings per Share, SEK | -0,19 | -0,28 | -1,16 |
| Equity per share, SEK | 0,48 | 0,26 | 0,18 |
| Number of Shares, end of period | 23 818 105 | 20 452 700 | 20 452 700 |
| Average number of shares | 23 013 334 | 20 452 700 | 20 070 980 |
| Share price end of period, SEK | 8,00 | 4,44 | 5,16 |
Parent company
Income statement (KSEK)
| Q1 | Q1 | FY | |
| 2023/24 | 2022/23 | 2022/23 | |
| Net sales | 2 354 | 1 846 | 9 837 |
| Cost of products sold | -652 | -1 076 | -4 968 |
| Gross profit | 1 702 | 770 | 4 869 |
| Gross margin | 72% | 42% | 49% |
| Selling expenses | -1 546 | -2 127 | -6 076 |
| Administrative expenses | -1 118 | -1 817 | -8 170 |
| R&D expenses | -1 732 | -1 699 | -6 782 |
| Operating result (EBIT) | -2 694 | -4 873 | -16 159 |
| Financial net | -738 | -80 | -2 836 |
| Result before tax (EBT) | -3 432 | -4 953 | -18 995 |
| Net Result (EAT) | -3 432 | -4 953 | -18 995 |
Balance sheet (KSEK)
| Q1 | Q1 | FY | |
| 2023/24 | 2022/23 | 2022/23 | |
| ASSETS | |||
| Non-current assets | |||
| Intangible assets | 20 689 | 17 456 | 19 654 |
| Tangible assets | 565 | 164 | 608 |
| Financial assets | 10 105 | 0 | 8 795 |
| Total non-current assets | 31 359 | 17 620 | 29 057 |
| Current Assets | |||
| Inventory | 3 827 | 3 623 | 3 332 |
| Short-term receivables | 11 085 | 6 138 | 4 080 |
| Cash and equivalents | 3 016 | 26 249 | 4 988 |
| Total current assets | 17 928 | 36 010 | 12 400 |
| Total assets | 49 287 | 53 630 | 41 457 |
| EQUITY AND LIABILITIES | |||
| Equity | 19 206 | 24 560 | 10 518 |
| Financial liabilities | 20 580 | 22 380 | 20 580 |
| Operating liabilities | 9 501 | 6 690 | 10 359 |
| Total equity and liabilities | 49 287 | 53 630 | 41 457 |