Interim Report 3 2022/23
Phase Holographic Imaging PHI AB (publ)
Lund, March 28, 2023
NOVEMBER 2022 – JANUARY 2023
| Net sales | 3 264 (2 736) KSEK |
| Operating result before depreciation (EBITDA) | -3 453 (-5 626) KSEK |
| Net result | -4 412 (-6 732) KSEK |
| Earnings per share | -0.22 (-0.47) SEK |
| Gross margin | 60 (72) % |
MAY 2022 – JANUARY 2023
| Net sales | 8 031 (6 927) KSEK |
| Operating result before depreciation (EBITDA) | -12 626 (-11 798) KSEK |
| Net result | -15 468 (-15 102) KSEK |
| Earnings per share | -0.76 (-1.05) SEK |
| Gross margin | 56 (72) % |
In Short
- Sales have continued to grow, with significantly higher cost efficiency. As a result, rolling 12-month sales gained to its highest level ever.
- The implementation of a quality control system within the company to achieve GAMP compliance has begun.
- A distributor agreement for India has been signed.
CEO Commentary
In the spring of 2022, PHI carried out a right issue. The goal of the right issue proceeds was:
- Finalize the fluorescence unit.
- Adapt our non-invasive imaging technology for regenerative medicine.
- Implement a quality control system within the company to achieve Good Automated Manufacturing Practice (GAMP) compliance.
- Develop cost-effective sales and marketing.
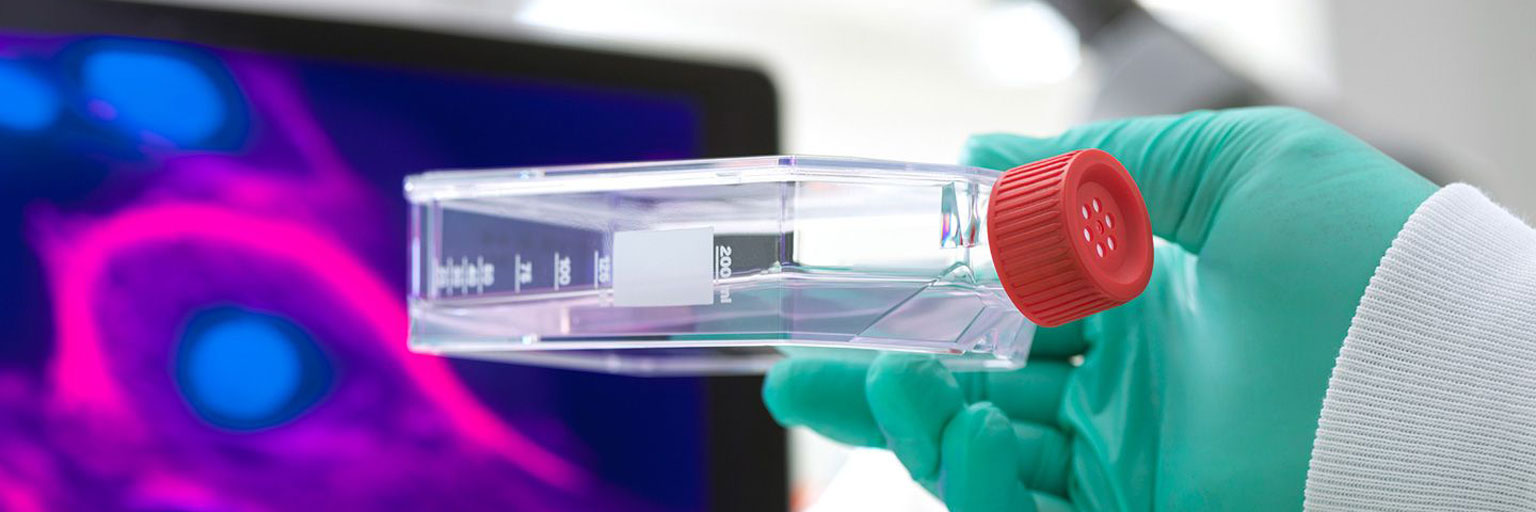
The objectives aim to take advantage of the newly created opportunities that our unique non-invasive reagent-free imaging technology provides. The success and ongoing industrialization of clinical regenerative medicine and cell-based therapies require non-invasive imaging, contrary to conventional drug development. Unlike traditional drugs, the cells are the treatment and can, therefore, under no circumstances be contaminated by analytical reagents or foreign substances, which is our unique edge.
During PHI’s third quarter, the pieces have come together:
- The 3rd quarter turnover exceeded any previous quarter.
- Rolling 12-months sales gained to its highest level ever.
- The marketing and sales process has been streamlined, which is reflected in the quarterly sales costs: -1 974 (-3 168) SEK.
- It is anticipated that sales will continue to grow and be further strengthened by fluorescence unit sales.
- With GAMP compliance, our addressable market will expand to include the much larger clinical market.
Within the ReMDO collaboration, we have so far created an alliance with Biospherix, SAS and QIAGEN to develop advanced cell manufacturing technology. The alliance has received a grant for in-kind resources from Wake Forrest Institute for Regenerative medicine (WFIRM) and ReMDO. Furthermore, to learn from the absolute leader in regenerative medicine and to consolidate our position as an important player in developing quality standards for biomanufacturing, we have opened an office adjacent to WFIRM.
With our well-reputed partners in the ReMDO project, the launch of the fluorescence unit, GAMP compliance and, above all, the need for non-invasive imaging technology within biomanufacturing, the board, I and our staff are convinced that the world is our oyster!

The Greater Perspective
In late 2022 the US Food & Drug Administration (FDA) created a “super office” to, in their own words, address the substantial growth in the development of innovative, novel products and the ever-changing public health landscape.
Over 7 000 rare diseases affect more than 30 million people in the United States, according to the FDA.
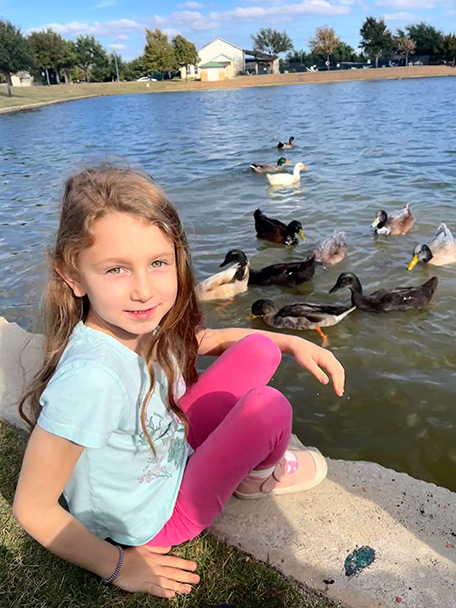
Evelyn was not expected to reach her second birthday. But fortunately, she was one the first infants to receive a newly developed gene therapy that today cures the rare genetic disease she suffered from, Spinal Muscular Atrophy, affecting one in 10 000 newborns.
However, her Zolgensma treatment costs $2.1 million per treatment — the second most expensive drug in the world. The currently most costly drug is another one-time gene therapy but for hemophilia (swe: blödarsjuka), priced at $3.5 million per dose when recently approved by the FDA.
The main motivator for the change within the FDA is the realization that we (humanity) now have the tools to cure many rare diseases; it’s merely a matter of applying the tools correctly, safely and cost-effectively.
In his presentation, Taking Cell & Gene Therapy to the Next Level, FDA director Peter Marks laid out the FDA’s strategy for making rare disease treatments available to all patients. As Dr. Marks explains, 7 minutes into the presentation, efficient and reliable manufacturing is essential to make such therapies commercially and economically viable.
Cell morphology mirrors the all-important quality and health status of a cell. The ability to non-invasively quantify the 3-dimensional morphology of cells directly in the cell culturing environment is a unique feature of our HoloMonitor product line, which has the potential to become a keystone technology in cost-effective biomanufacturing.
The FDA needs support from innovative technology companies like PHI. Through the Alliance to Advance Cell-based Biomanufacturing, PHI has the opportunity to work with the FDA to fulfill its vision of an efficient manufacturing process to make custom treatments commercially viable and, not least, affordable. With the continued support from our shareholders, nothing can stop us.
Links
- Meet Evelyn
- Rare Diseases at FDA
- Taking Cell & Gene Therapy to the Next Level
- Establishment of the Office of Therapeutic Products
- PHI, SAS, QIAGEN and BioSpherix form Alliance to Advance Cell-based Biomanufacturing
- FDA approves $3.5 million treatment for hemophilia, now the most expensive drug in the world
Net Sales and Result
Net sales for the second quarter amounted to 3 264 (2 736) KSEK and operating results before depreciation (EBITDA) to -3 453 (-5 626) KSEK. The net result amounted to -4 412 (-6 732) KSEK.

Investments
With an emphasis on regenerative medicine and the development of fluorescence capability, the company invested 1 195 (1 288) KSEK in the product, patent, and application development during the period.
Financing
Cash, cash equivalents, and unutilized granted credits amounted to 13 572 (12 838) KSEK by the end of the period. The equity ratio was 29 (-41) %.
Warrants of series TO 3
Each warrant of series TO 3 entitles to subscribe for one (1) new share in PHI during the period from 11 April 2023 to 2 May 2023. The exercise price amounts to 70 % of the volume-weighted average price during a period prior to option redemption, within the interval 0.20 SEK (the company’s quota value) as the lowest, and with 11.90 SEK per new share as the highest exercise price. Upon full exercise of warrants of series TO 3 at the highest exercise price (11.90 SEK per new share), the warrants will provide the company with approximately 40 MSEK before issue costs.
Warrants of series TO 4
Each warrant of series TO 4 entitles to subscribe for one (1) new share in PHI during the period from and including 12 September 2024 to and including 3 October 2024. The exercise price amounts to 70 % of the volume-weighted average price during a period prior to option redemption, within the interval 0.20 SEK as the lowest, and with 15.45 SEK per new share as the highest exercise price. Upon full exercise of warrants of series TO 4 at the highest exercise price (15.45 SEK per new share), the warrants will provide the company with approximately 20.8 MSEK before issue costs.
Convertibles
The convertible loan to Formue Nord Fokus A/S amounts to 20 230 000 SEK with the following terms:
- Number of convertibles: 1 700 000 convertibles, which entails the right to subscribe for 1 700 000 new shares.
- Conversion rates: 11.90 SEK per new share until 2 May 2023 (last day in the exercise period for warrants of series TO 3) and 15.45 SEK per new share from May 3, 2023, until October 16, 2024.
- Conversion period: the convertible holder is entitled during the period from the date of payment to October 16 2024 to convert the loan into shares.
- Maturity: in the event that the entire loan is not converted, repayment of the loan and interest must take place no later than October 16, 2024. The company has the right to repay all or part of the convertible loan at any time until the due date, after which Formue Nord has the opportunity to accept repayment or request conversion according to the above conversion rates.
- Interest: the convertibles run at a quarterly interest rate of 3%.
Dilution of shares
| Total shares January 31, 2023 | 20 452 700 |
| TO 3 (April 2023) | 3 365 605 |
| TO 4 (September 2024) | 1 346 162 |
| Convertibles | 1 700 000 |
| TOTAL | 26 864 467 |
Risks
The company may be affected by various factors, described in the 2021/22 Annual Report. These factors may individually or jointly increase risks for the operation and result of the company.
Accounting Principles
The accounts are prepared in accordance with the Annual Accounts Act and general advice from the Swedish Accounting Standards Board BFNAR 2012:1 Annual accounts and consolidated accounts (K3).
Review
This interim report has not been subject to review by the company’s auditor.
Statements About the Future
Statements concerning the company’s business environment and the future in this report reflect the board of director’s current view of future events and financial developments. Forward-looking statements only express the judgments and assumptions made by the board of directors on the day of the report. These statements have been carefully assessed. However, it is brought to the reader’s attention that these statements are associated with uncertainty, like all statements about the future.
Calendar
- June 23, 2023, Year-end report 2022/23
About PHI
Phase Holographic Imaging (PHI) develops and markets instrumentation for non-invasive time-lapse imaging. The company’s HoloMonitor product line is used for long-term quantitative analysis of living cell cultures, particularly in preclinical research and regenerative medicine. PHI is based in Lund, Sweden and Boston, Massachusetts.
On behalf of the Board of Directors
Patrik Eschricht, CEO
For additional information please contact:
Patrik Eschricht
Tel: +46 702 69 99 61
E-mail: ir@phiab.se
Web: www.phiab.com
Consolidated – PHI Group
Income statement (KSEK)
| Q3 | Q3 | YTD | YTD | FY | |
| 2022/23 | 2021/22 | 2022/23 | 2021/22 | 2021/22 | |
| Net sales | 3 264 | 2 736 | 8 031 | 6 927 | 8 169 |
| Cost of products sold | -1 304 | -894 | -3 539 | -1 961 | -2 485 |
| Gross profit | 1 960 | 1 842 | 4 492 | 4 966 | 5 684 |
| Gross margin | 60% | 72% | 56% | 72% | 70% |
| Selling expenses | -1 974 | -3 168 | -7 634 | -7 129 | -9 303 |
| Administrative expenses | -2 671 | -2 901 | -6 510 | -6 616 | -7 388 |
| R&D expenses | -1 641 | -2 394 | -5 579 | -6 011 | -8 817 |
| Operating result (EBIT) | -4 327 | -6 621 | -15 231 | -14 790 | -19 824 |
| Financial net | -85 | -111 | -237 | -312 | -5 557 |
| Result before tax (EBT) | -4 412 | -6 732 | -15 468 | -15 102 | -25 381 |
| Net Result (EAT) | -4 412 | -6 732 | -15 468 | -15 102 | -25 381 |
Balance sheet (KSEK)
| Q3 | Q3 | FY | |
| 2022/23 | 2021/22 | 2021/22 | |
| ASSETS | |||
| Non-current assets | |||
| Intangible assets | 17 825 | 16 019 | 17 038 |
| Tangible assets | 652 | 185 | 181 |
| Total non-current assets | 18 477 | 16 204 | 17 219 |
| Current Assets | |||
| Inventory | 3 657 | 2 217 | 2 979 |
| Short-term receivables | 6 051 | 3 820 | 36 061 |
| Cash and equivalents | 11 572 | 1 791 | 1 424 |
| Total current assets | 21 280 | 7 828 | 40 464 |
| Total assets | 39 757 | 24 032 | 57 683 |
| EQUITY AND LIABILITIES | |||
| Equity | 11 357 | -9 855 | 26 983 |
| Financial liabilities | 22 380 | 28 763 | 23 424 |
| Operating liabilities | 6 020 | 5 124 | 7 276 |
| Total equity and liabilities | 39 757 | 24 032 | 57 683 |
Changes in equity (KSEK)
| Q3 | Q3 | FY | |
| 2022/23 | 2021/22 | 2021/22 | |
| Opening Balance | 15 547 | -3 004 | 5 384 |
| Equity issues, net | 47 268 | ||
| Net profit | -4 412 | -6 732 | -25 381 |
| Translation difference | 222 | -119 | -288 |
| Closing balance | 11 357 | -9 855 | 26 983 |
| Equity ratio | 29% | -41% | 47% |
Cash flow analysis (KSEK)
| Q3 | Q3 | YTD | YTD | FY | |
| 2022/23 | 2021/22 | 2022/23 | 2021/22 | 2021/22 | |
| Operating activities | |||||
| Net result | -4 412 | -6 732 | -15 468 | -15 102 | -25 382 |
| Depreciation | 874 | 995 | 2 605 | 2 992 | 4 854 |
| Translation difference | 312 | -120 | 312 | -138 | -491 |
| Operating cash flow | -3 226 | -5 857 | -12 551 | -12 248 | -21 019 |
| Increase (-)/decrease (+) in inventories | 490 | 282 | -678 | -883 | -1 645 |
| Increase (-)/decrease (+) in operating receivables | -2 927 | -609 | 29 540 | -882 | 24 580 |
| Increase (+)/decrease (-) in operating liabilities | -1 579 | -2 110 | -1 256 | -3 780 | -981 |
| Change in working capital | -4 016 | -2 437 | 27 606 | -5 545 | 21 954 |
| Cash flow from operating activities | -7 242 | -8 294 | 15 055 | -17 793 | 1 139 |
| Investing activities | |||||
| Development expenses | -1 195 | -1 288 | -3 325 | -4 035 | -6 539 |
| Patents | -1 | -326 | |||
| Tangible assets | -538 | -538 | -48 | ||
| Cash flow after investments | -8 975 | -9 583 | 11 192 | -21 828 | -5 774 |
| Financing activities | |||||
| Net proceeds from equity issues | -10 279 | ||||
| Increase (+)/decrease (-) in borrowings | 132 | 10 113 | -1 044 | 21 363 | 15 221 |
| Cash flow from financing activities | 132 | 10 113 | -1 044 | 21 363 | 4 942 |
| Cash flow for the period | -8 843 | 530 | 10 148 | -465 | -832 |
| Cash and cash equivalents at the beginning of the period | 20 415 | 1 261 | 1 424 | 2 256 | 2 256 |
| Cash and cash equivalents at the end of the period | 11 572 | 1 791 | 11 572 | 1 791 | 1 424 |
| Incl. unutilized credits | 13 572 | 12 838 | 13 572 | 12 838 | 2 508 |
Data per share
| Q3 | Q3 | YTD | YTD | FY | ||
| 2022/23 | 2021/22 | 2022/23 | 2021/22 | 2021/22 | ||
| Earnings per Share, SEK | -0,22 | -0,47 | -0,76 | -1,05 | -1,76 | |
| Equity per share, SEK | 0,26 | -0,68 | 0,76 | -0,68 | 1,32* | |
| Not registrated shares 31 of April | 6 057 729 | |||||
| Number of Shares, end of period | 20 452 700 | 14 394 971 | 20 452 700 | 14 394 971 | 14 394 971 | |
| Average number of shares | 20 452 700 | 14 394 971 | 20 452 700 | 14 394 971 | 14 394 971 | |
| Share price end of period, SEK | 1,90 | 18,60 | 1,90 | 18,60 | 5,60 | |
| *Equity per share includes subscribed but not registrated shares | ||||||
Parent company
Income statement (KSEK)
| Q3 | Q3 | YTD | YTD | FY | |
| 2022/23 | 2021/22 | 2022/23 | 2021/22 | 2021/22 | |
| Net sales | 2 751 | 2 393 | 6 880 | 4 871 | 6 437 |
| Cost of products sold | -916 | -815 | -3 413 | -1 882 | -2 417 |
| Gross profit | 1 835 | 1 578 | 3 467 | 2 989 | 4 020 |
| Gross margin | 67% | 66% | 50% | 61% | 62% |
| Selling expenses | -843 | -2 534 | -4 568 | -5 056 | -6 412 |
| Administrative expenses | -2 671 | -2 901 | -6 510 | -6 616 | -7 388 |
| R&D expenses | -1 641 | -2 394 | -5 579 | -6 011 | -8 817 |
| Operating result (EBIT) | -3 320 | -6 251 | -13 190 | -14 694 | -18 597 |
| Financial net | -85 | -111 | -237 | -312 | -5 557 |
| Result before tax (EBT) | -3 405 | -6 362 | -13 427 | -15 006 | -24 154 |
| Net Result (EAT) | -3 405 | -6 362 | -13 427 | -15 006 | -24 154 |
Balance sheet (KSEK)
| Q3 | Q3 | FY | |
| 2022/23 | 2021/22 | 2021/22 | |
| ASSETS | |||
| Non-current assets | |||
| Intangible assets | 17 825 | 16 019 | 17 038 |
| Tangible assets | 652 | 185 | 181 |
| Financial assets | 3 994 | ||
| Total non-current assets | 18 477 | 16 204 | 21 213 |
| Current Assets | |||
| Inventory | 3 272 | 2 217 | 2 979 |
| Short-term receivables | 11 633 | 5 897 | 34 864 |
| Cash and equivalents | 10 947 | 834 | 721 |
| Total current assets | 25 852 | 8 948 | 38 564 |
| Total assets | 44 329 | 25 152 | 59 777 |
| EQUITY AND LIABILITIES | |||
| Equity | 16 086 | -8 607 | 29 513 |
| Financial liabilities | 22 380 | 28 650 | 22 380 |
| Operating liabilities | 5 863 | 5 109 | 7 884 |
| Total equity and liabilities | 44 329 | 25 152 | 59 777 |