Year-end Report 2022/23
Phase Holographic Imaging PHI AB (publ)
Lund, June 26, 2023
FEBRUARY 2023 – APRIL 2023
| Net sales | 1 869 (1 242) KSEK |
| Operating result before depreciation (EBITDA) | -4 240 (-3 173) KSEK |
| Net result | -7 717 (-10 279) KSEK |
| Earnings per share | -0.38 (-0.71) SEK |
| Gross margin | 31 (63) % |
MAY 2022 – APRIL 2023
| Net sales | 9 900 (8 169) KSEK |
| Operating result before depreciation (EBITDA) | -16 866 (-14 791) KSEK |
| Net result | -23 185 (-25 381) KSEK |
| Earnings per share | -1.16 (-1.76) SEK |
| Gross margin | 51 (70) % |
In Short
- Sales continue to grow, and the year ended up with the highest turnover for a year in PHI, so far.
- The Fluorescence unit is ready for launch in June.
CEO Commentary
It is easy to forget that PHI consists of only 17 dedicated employees when you look at the organization’s achievements in recent months.
- We have completed TO 3 with a 100 percent coverage rate. As a result, we have received approximately SEK 12.7 million before transaction costs.
- We have a new partner and major shareholder in Altium.
- Together with our partners in the ReMDO project, we published the article Cytocentric Measurement for Regenerative Medicine.
- The HoloMonitor fluorescence unit was launched in parallel at major scientific conferences, EACR in Turin and ISSCR in Boston.
- Our CSO Kersti Alm spoke at the World Stem Summit in Winston Salem together with NIST, among others.
Sales and marketing
PHI is presently in a transformation phase where we are increasingly moving sales to our distributors to focus on PHI’s core business and the development of HoloMonitor products for regenerative medicine and other clinical applications. Furthermore, we aim to intensely promote the core HoloMonitor technology — quantitative phase imaging (QPI) — towards governing bodies as a non-invasive quality control tool in regulated environments such as hospitals, clinics and therapy manufacturing facilities.
During the transition period, we will actively work with direct sales and sales through our distributor network to reduce risk. Consequently, we will temporarily have reduced margins and higher sales and marketing costs than expected.
New major owner
With Altium’s entry, PHI has gained a major owner with the same vision who sees the same opportunities for our non-invasive technology in regenerative medicine. In addition, with Altium’s contact network, we see an opportunity to expand our agent and distribution network in a completely different way than we can ourselves. When developing new products and changes in our software, PHI’s laboratory resources have been a bottleneck. With Altium’s resources and own laboratories, we hope that hardware and software validation will go significantly faster and smoother.
At an extraordinary general meeting in April 2023, Altium’s CEO Goran Dubravčić was elected to PHI’s board.
Fluorescence (M4FL)
Our latest product portfolio addition, HoloMonitor M4FL, has been launched, and the order book has been opened. Initially, PHI handles the assembly of the first units we deliver. However, starting in September, we will begin receiving units directly from our manufacturer, Optronics.
PHI MIPS AB
During this quarter, PHI established a subsidiary for intellectual property rights concerning synthetic antibodies and the outcome of the GlycoImaging project.
With a pending EU patent and granted patents in the US and Japan, we expect to soon have patent rights in the major markets for a potential new screening method to diagnose cancer at its early stages. The newly established, dedicated subsidiary will allow easier communication and transparency around the synthetic antibody patents and our core business.
ReMDO
PHI has its own biomedical engineer on-site at the Wake Forest Institute for Regenerative Medicine (WFIRM) in Winston-Salem, running live cell experiments as well as coordinating our efforts with our partners. This is an important step for the project to develop as quickly as possible, especially as the head office in Lund is in a time zone that deviates 6 hours from the Winston-Salem time zone.
Some of our colleagues and I had a guided tour of WFIRM a few weeks ago. It felt to me like entering the scenes of a captivating science fiction film. The room buzzed with awe-inspiring innovations, like the presence of portable 3D printers capable of generating new skin directly at the patient’s bedside, using their own cells to treat conditions such as burns. And there it was, a unique “gym” dedicated to printed organs, as those organs required to build muscles before transplantation—a true marvel of regenerative medicine.
I witnessed that regenerative medicine is already here and that we, PHI, stand in the midst of this extraordinary landscape, ready to go from our current pre-clinical to the significantly larger clinical market. With our involvement in the ReMDO project, we are taking strides toward adapting our QPI technology to enable cell quality control in regenerative medicine and therefore help make regenerative medicine affordable, accessible and patient-safe — for everyone.

The Greater Perspective
Regenerative medicine is the process of rejuvenating cells, tissues or complete organs to restore normal function. Yet, before these novel life-saving treatments can be made available to the general population, production must be scaled and standardized to consistently deliver safe and effective therapies in large quantities. HoloMonitor’s core technology — quantitative phase imaging (QPI) — has been shown to meet associated quality control needs.

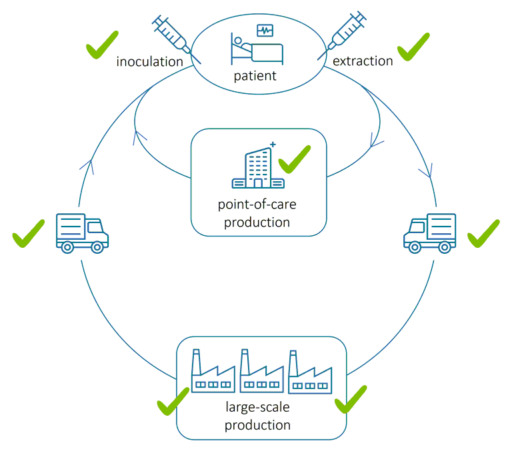
The above image illustrates the flow of extracting, transporting, producing and inoculating cells in regenerative medicine. During and after cell extraction, comprehensive cell health monitoring is required from bedside to bedside to ensure efficient manufacturing, patient safety and therapeutic efficacy throughout the manufacturing cycle. The checkmarks indicate where QPI assessment is applicable.
QPI and its unique non-invasive properties will be an important part of the manufacturing process. Fortunately, QPI is an established commercially available technology. However, it remains to be adapted to large-scale cell culturing and manufacturing:
- Regulatory-compliant protocols must be developed to ensure consistent and traceable analytical results.
- Algorithms must be trained to evaluate the vast amounts of acquired information to present results and make outcome predictions. For instance, the software can be trained to predict future cell death to identify low-quality cell cultures early in the manufacturing cycle.
- Furthermore, hardware must be adapted for the various roles in the above manufacturing and delivery cycle.
The ongoing adaptation work of QPI for regenerative medicine by PHI and partners was recently presented at the Word Stem Cell Summit and further presented in an invited article to appear in BioPhotonics.
Net Sales and Result
Net sales for the fourth quarter amounted to 1 869 (1 242) KSEK and operating results before depreciation (EBITDA) to -4 240 (-3 173) KSEK. The net result amounted to -7 717 (-10 279) KSEK. The gross margin has been affected by a higher proportion of units being sold through distributors than direct sales.

Investments
With an emphasis on regenerative medicine and the development of fluorescence capability, the company invested 2 667 (2 674) KSEK in the product, patent, and application development during the period.
Financing
Cash, cash equivalents, and unutilized granted credits amounted to 7 307(2 508) KSEK by the end of the period. The equity ratio was 11 (47) %.
Warrants of series TO 3
On 2 May 2023, the exercise period for warrants of series TO 3 (“TO 3”), which were issued in connection with Phase Holographic Imaging PHI AB’s (“PHI” or the “Company”) rights issue of units that were announced on 22 February 2022, ended. 3 201 739 warrants of series TO 3 were exercised, corresponding to a subscription ratio of approximately 95.1 percent. Thus, the underwriting commitment relating to TO 3, which the Company agreed on during the exercise period, is activated. The decision on a directed share issue of 163 666 shares, corresponding to the remaining approximately 4.9 percent of the warrant exercise, to the underwriter Altium SA (“Altium”) will be made within the coming days, with the support of the authorization given by the annual general meeting held on 31 October 2022. The proceeds of the TO 3 warrants amount to approximately SEK 12.7 million before the deduction of transaction-related costs, corresponding to a subscription rate of 100 percent.
Warrants of series TO 4
Each warrant of series TO 4 entitles to subscribe for one (1) new share in PHI during the period from and including 12 September 2024 to and including 3 October 2024. The exercise price amounts to 70 % of the volume-weighted average price during a period prior to option redemption, within the interval 0.20 SEK as the lowest, and with 15.45 SEK per new share as the highest exercise price. Upon full exercise of warrants of series TO 4 at the highest exercise price (15.45 SEK per new share), the warrants will provide the company with approximately 20.8 MSEK before issue costs.
Convertibles
The convertible loan to Formue Nord Fokus A/S amounts to 20 230 000 SEK with the following terms:
- Number of convertibles: 1 700 000 convertibles, which entails the right to subscribe for 1 700 000 new shares.
- Conversion rates: 11.90 SEK per new share until 2 May 2023 (last day in the exercise period for warrants of series TO 3) and 15.45 SEK per new share from May 3, 2023, until October 16, 2024.
- Conversion period: the convertible holder is entitled during the period from the date of payment to October 16 2024 to convert the loan into shares.
- Maturity: in the event that the entire loan is not converted, repayment of the loan and interest must take place no later than October 16, 2024. The company has the right to repay all or part of the convertible loan at any time until the due date, after which Formue Nord has the opportunity to accept repayment or request conversion according to the above conversion rates.
- Interest: the convertibles run at a quarterly interest rate of 3%.
Dilution of shares
| Total shares April 30, 2023 | 20 452 700 |
| TO 3 (April 2023, registered at Bolagsverket May 2023) | 3 365 405 |
| TO 4 (September 2024) | 1 346 162 |
| Convertibles | 1 700 000 |
| TOTAL | 26 864 267 |
Proposal for allocation of profit
The board proposes that the year’s loss of -23 186 is offset against the share premium fund.
Risks
The company may be affected by various factors, described in the 2021/22 Annual Report. These factors may individually or jointly increase risks for the operation and result of the company.
Accounting Principles
The accounts are prepared in accordance with the Annual Accounts Act and general advice from the Swedish Accounting Standards Board BFNAR 2012:1 Annual accounts and consolidated accounts (K3).
Review
This interim report has not been subject to review by the company’s auditor.
Statements About the Future
Statements concerning the company’s business environment and the future in this report reflect the board of director’s current view of future events and financial developments. Forward-looking statements only express the judgments and assumptions made by the board of directors on the day of the report. These statements have been carefully assessed. However, it is brought to the reader’s attention that these statements are associated with uncertainty, like all statements about the future.
Calendar
- End of September: Publication of annual report which will be available in our office in Lund and on www.phiab.com
- 12th of October: Annual general meeting in Lund
About PHI
Phase Holographic Imaging (PHI) develops and markets instrumentation for non-invasive time-lapse imaging. The company’s HoloMonitor product line is used for long-term quantitative analysis of living cell cultures, particularly in preclinical research and regenerative medicine. PHI is based in Lund, Sweden and Boston, Massachusetts.
On behalf of the Board of Directors
Patrik Eschricht, CEO
For additional information please contact:
Patrik Eschricht
Tel: +46 702 69 99 61
E-mail: ir@phiab.se
Web: www.phiab.com
Consolidated – PHI Group
Income statement (KSEK)
| Q4 | Q4 | FY | FY | |
| 2022/23 | 2021/22 | 2022/23 | 2021/22 | |
| Net sales | 1 869 | 1 242 | 9 900 | 8 169 |
| Cost of sold products | -1 293 | -524 | -4 832 | -2 485 |
| Gross profit | 576 | 718 | 5 068 | 5 684 |
| Gross margin | 31% | 63% | 51% | 70% |
| Selling expenses | -2 834 | -2 174 | -10 468 | -9 303 |
| Administrative expenses | -1 660 | -772 | -8 170 | -7 388 |
| R&D expenses | -1 203 | -2 806 | -6 782 | -8 817 |
| Operating result (EBIT) | -5 121 | -5 034 | -20 352 | -19 824 |
| Financial net | -2 596 | -5 245 | -2 833 | -5 557 |
| Result before tax (EBT) | -7 717 | -10 279 | -23 185 | -25 381 |
| Net Result (EAT) | -7 717 | -10 279 | -23 185 | -25 381 |
Balance sheet (KSEK)
| FY | FY | |
| 2022/23 | 2021/22 | |
| ASSETS | ||
| Non-current assets | ||
| Intangible assets | 19 654 | 17 038 |
| Tangible assets | 608 | 181 |
| Total non-current assets | 20 262 | 17 219 |
| Current Assets | ||
| Inventory | 3 846 | 2 979 |
| Short-term receivables | 5 422 | 35 792 |
| Cash and equivalents | 5 307 | 1 424 |
| Total current assets | 14 575 | 40 195 |
| Total assets | 34 837 | 57 414 |
| EQUITY AND LIABILITIES | ||
| Equity | 3 728 | 26 983 |
| Financial liabilities | 20 580 | 22 508 |
| Operating liabilities | 10 529 | 7 923 |
| Total equity and liabilities | 34 837 | 57 414 |
Changes in equity (KSEK)
| FY | FY | |
| 2022/23 | 2021/22 | |
| Opening Balance | 26 983 | 5 384 |
| Equity issues, net | 47 268 | |
| Net profit | -23 185 | -25 381 |
| Translation difference | -70 | -288 |
| Closing balance | 3 728 | 26 983 |
| Equity ratio | 11% | 47% |
Cash flow analysis (KSEK)
| Q4 | Q4 | FY | FY | |
| 2022/23 | 2021/22 | 2022/23 | 2021/22 | |
| Operating activities | ||||
| Net result | -7 717 | -10 280 | -23 185 | -25 382 |
| Depreciation | 881 | 1 862 | 3 486 | 4 854 |
| Translation difference | 86 | -353 | -70 | -491 |
| Operating cash flow | -6 749 | -8 771 | -19 768 | -21 019 |
| Increase (-)/decrease (+) in inventories | -189 | -762 | -867 | -1 645 |
| Increase (-)/decrease (+) in operating receivables | 629 | -31 972 | 30 639 | 24 580 |
| Increase (+)/decrease (-) in operating liabilities | 4 509 | 2 799 | 3 252 | -981 |
| Change in working capital | 4 949 | -29 935 | 33 024 | 21 954 |
| Cash flow from operating activities | -1 800 | -38 706 | 13 256 | 1 139 |
| Investing activities | ||||
| Development expenses | -2 612 | -2 504 | -5 938 | -6 539 |
| Patents | -54 | -170 | -54 | -326 |
| Tangible assets | 1 | -538 | -48 | |
| Cash flow after investments | -4 465 | -41 380 | 6 727 | -5 774 |
| Financing activities | ||||
| Net proceeds from equity issues | 47 268 | -10 279 | ||
| Increase (+)/decrease (-) in borrowings | -1 800 | -6 255 | -2 844 | 15 221 |
| Cash flow from financing activities | -1 800 | 41 013 | -2 844 | 4 942 |
| Cash flow for the period | -6 265 | -367 | 3 883 | -832 |
| Cash and cash equivalents at the beginning of the period | 11 572 | 1 791 | 1 424 | 2 256 |
| Cash and cash equivalents at the end of the period | 5 307 | 1 424 | 5 307 | 1 424 |
| Incl. unutilized credits | 7 307 | 2 508 | 7 307 | 2 508 |
Data per share
| Q4 | Q4 | YTD | YTD | |
| 2022/23 | 2021/22 | 2022/23 | 2021/22 | |
| Earnings per Share, SEK | -0.38 | -0.71 | -1.16 | -1.76 |
| Equity per share, SEK | 0.18 | 1.32 | 0.18 | 1.32* |
| Non-registered shares April 30th 2022 | 6 057 729 | 6 057 729 | ||
| Number of Shares, end of period | 20 452 700 | 14 394 971 | 20 452 700 | 14 394 971 |
| Average number of shares | 20 070 980 | 14 394 971 | 20 070 980 | 14 394 971 |
| Share price end of period, SEK | 5.16 | 5.60 | 5.16 | 5.60 |
Parent company
Income statement (KSEK)
| Q4 | Q4 | YTD | YTD | |
| 2022/23 | 2021/22 | 2022/23 | 2021/22 | |
| Net sales | 2 957 | 1 566 | 9 837 | 6 437 |
| Cost of products sold | -1 555 | -535 | -4 968 | -2 417 |
| Gross profit | 1 402 | 1 031 | 4 869 | 4 020 |
| Gross margin | 47% | 66% | 49% | 62% |
| Selling expenses | -1 508 | -1 356 | -6 076 | -6 412 |
| Administrative expenses | -1 660 | -772 | -8 170 | -7 388 |
| R&D expenses | -1 203 | -2 806 | -6 782 | -8 817 |
| Operating result (EBIT) | -2 969 | -3 903 | -16 159 | -18 597 |
| Financial net | -2 599 | -5 245 | -2 836 | -5 557 |
| Result before tax (EBT) | -5 568 | -9 148 | -18 995 | -24 154 |
| Net Result (EAT) | -5 568 | -9 148 | -18 995 | -24 154 |
Balance sheet (KSEK)
| FY | FY | |
| 2022/23 | 2021/22 | |
| ASSETS | ||
| Non-current assets | ||
| Intangible assets | 19 654 | 17 038 |
| Tangible assets | 608 | 181 |
| Financial assets | 8 795 | 3 994 |
| Total non-current assets | 29 057 | 21 213 |
| Current Assets | ||
| Inventory | 3 332 | 2 979 |
| Short-term receivables | 4 208 | 34 864 |
| Cash and equivalents | 4 988 | 721 |
| Total current assets | 12 528 | 38 564 |
| Total assets | 41 585 | 59 777 |
| EQUITY AND LIABILITIES | ||
| Equity | 10 518 | 29 513 |
| Financial liabilities | 20 580 | 22 380 |
| Operating liabilities | 10 487 | 7 884 |
| Total equity and liabilities | 41 585 | 59 777 |


