Kinetic Dose Response Assay Protocol
This protocol helps to set up a Kinetic Dose Response Assay using HoloMonitor® M4 and the HoloMonitor® App Suite software. The HoloMonitor® Kinetic Dose Response Assay automatically analyzes drug responses in adherent cells. Results are displayed as an interactive response curve, where results for each condition can be displayed for any selected time point.
Requirements:
- HoloMonitor® M4, placed in incubator
- HoloMonitor® M4 App Suite
- Culture vessel of choice with cells
- HoloLid™ for selected vessel
- Vessel holder for selected vessel
Output:
- Interactive dose-response curve
- Cell count (cells/cm2)
- Confluence (%)
- Mean cell volume (μm3)
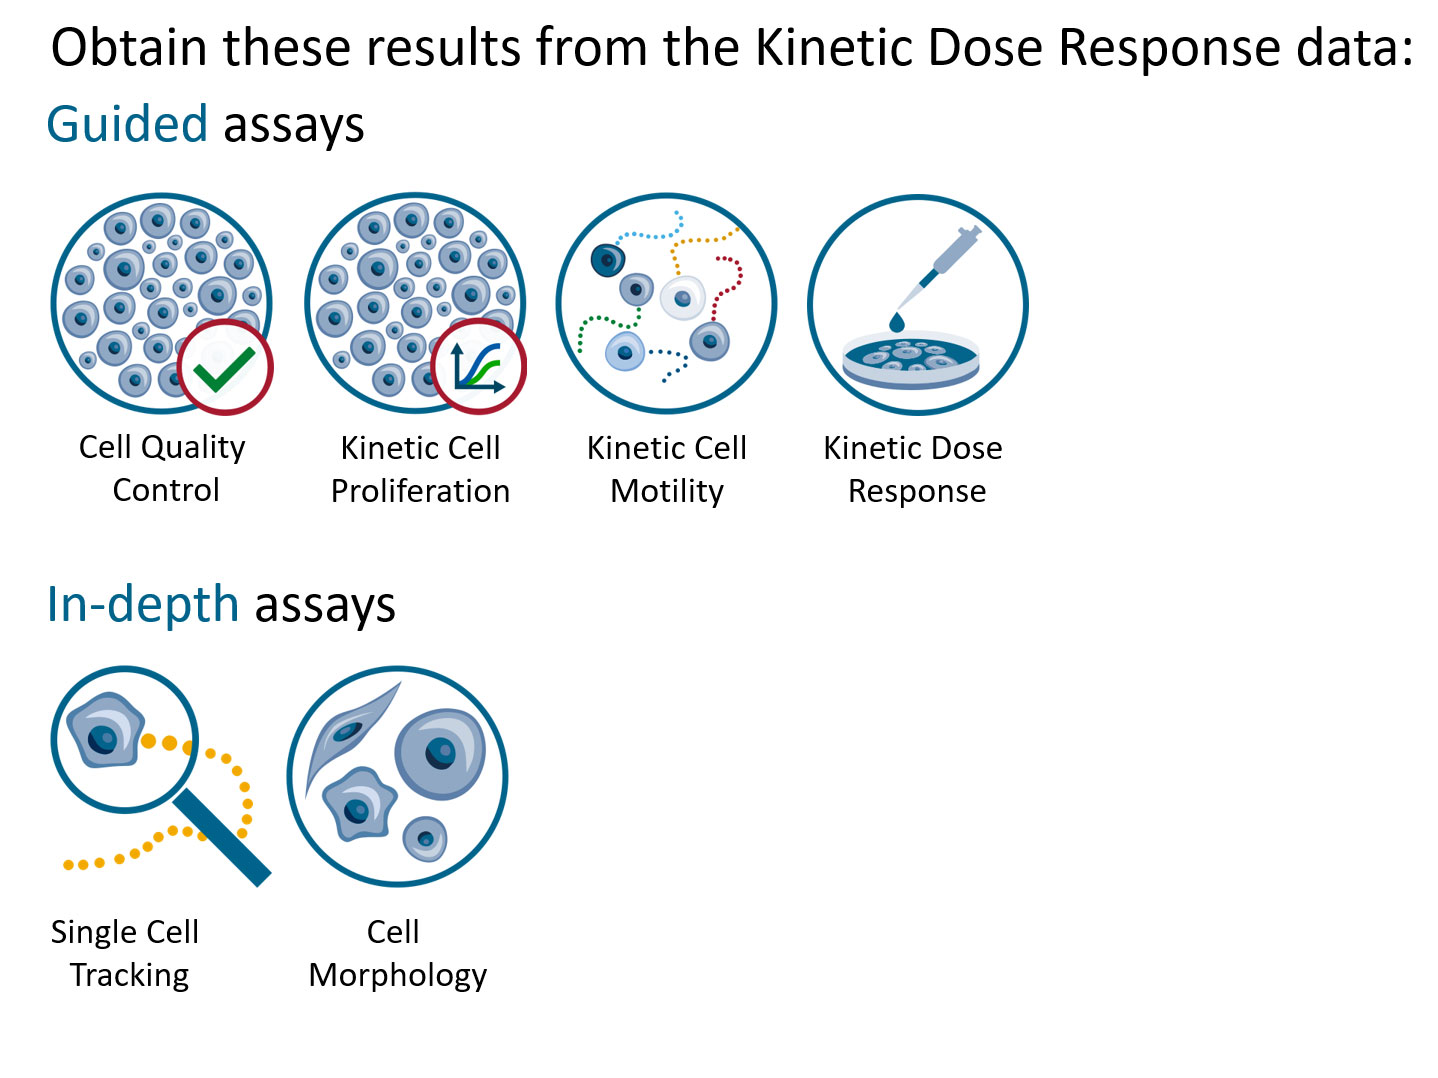
Reanalysis:
- Guided assays
- In-depth analysis
PREPARATIONS
Materials:
- HoloMonitor® M4, placed inside the incubator
- HoloMonitor® App Suite software
- Cell culture vessel. Please check our list of recommended vessels.
- HoloLid™ for the selected vessel
- Vessel holder for selected vessel
- Setup and Operation Manual for HoloMonitor® M4
Steps
Seed the cells with about 5 % confluence (ca. 6000 – 11000 cells/cm2).
►Please note that too few cells may lead to inadequate results due to auto-focus failure.
Place the vessel in the incubator and let cells attach for 2-24 hours.
Start the software and wait for complete instrument initialization.
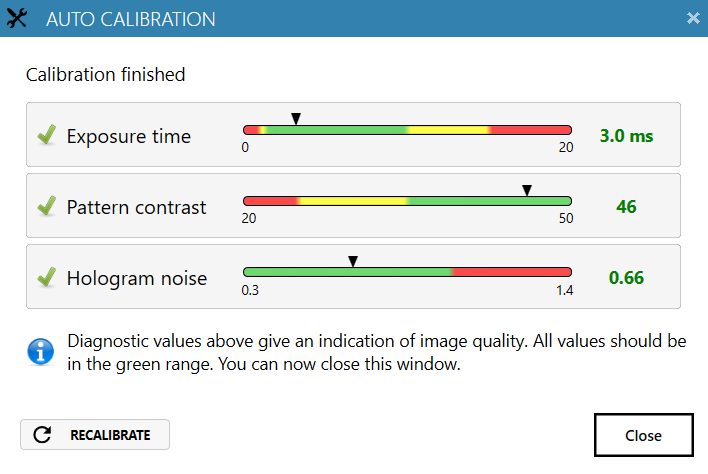
Run an auto-calibration. With successful calibration (as shown in the picture), the instrument is ready to use.
| Vessel |
Vendor cat. number | HoloLid™ |
Final working volume |
Growth area, cm2/well |
Vessel cut in a holder |
| Sarstedt TC-dish 35 | 83.3900 | 71110 | 3.0 mL/well | 8.00 | NA |
| Sarstedt TC 6-well plate | 83.3920.005 | 71120 | 3.0 mL/well | 8.80 | top left |
| Sarstedt lumox® 24-multiwell plate | 94.6000.014 | 71130 | 1.9 mL/well | 1.90 | top left |
| Sarstedt lumox® 96-multiwell plate | 94.6000.024 | 71140 | 170 µL/well | 0.34 | top left |
| ibidi® μ-dish 35 mm, high | 81156 | 71111 | 2.5 mL/well | 3.50 | NA |
| ibidi® μ-plate 24 Well Black | 80241 | 71131 | 2.5 mL/well | 1.90 | NA |
| Eppendorf CCCadvanced® FN1 – 6 well | 0038110010 | 71150 | 3.0 mL/well | 9.40 | bottom right |
Sterilize the HoloLids™ according to the HoloLid™ sterilization and use protocol.
Add the treatment to your cells. The final working volumes per well, essential for using HoloLids™, are shown in the table above.
Slide the cell culture vessel onto the Vessel holder, its grips facing towards you. Ensure that the vessel is parallel to the holder. There is a spring that holds the vessel in place.
►When using multi-well plates, place them with the cut-off corner to the left.
Replace the standard lids with the HoloLid™.
Put the vessel holder with the sample on the HoloMonitor® M4 stage.
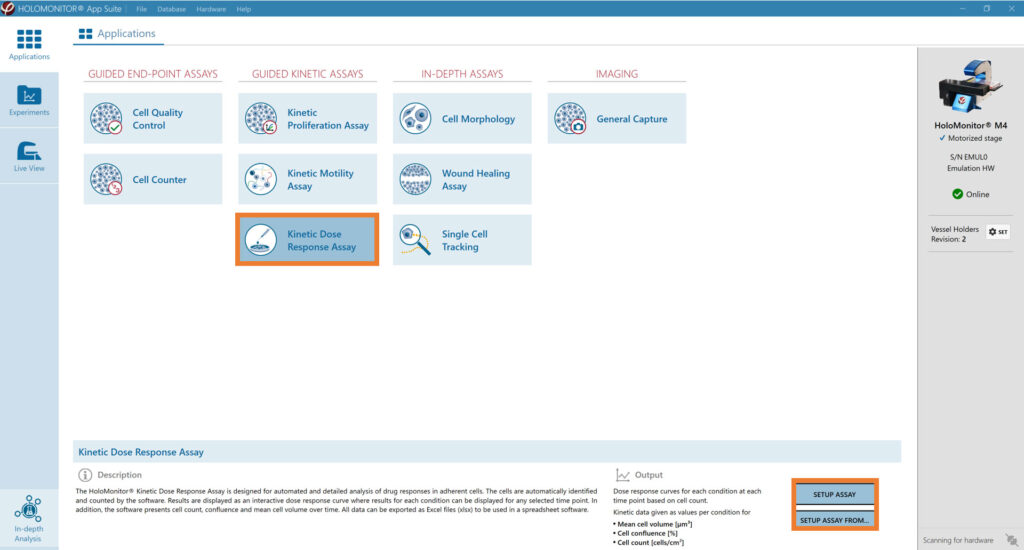
Select the Kinetic Dose Response Assay and proceed by clicking the Setup Capture button.
EXPERIMENT SETUP
Basic setup: Describe the experiment and assign treatments/conditions to the wells
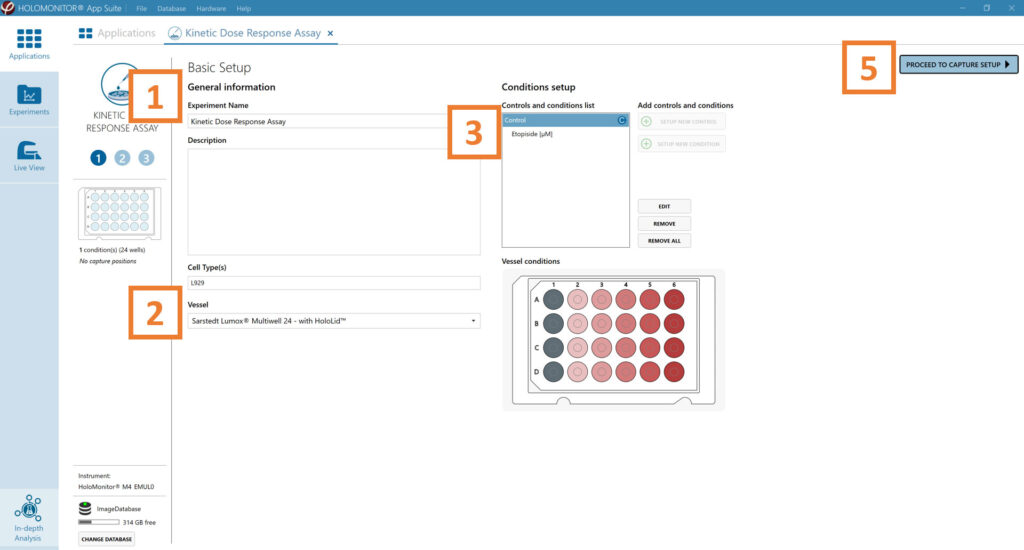
Enter the experiment name, optional experiment
description and cell types.
Select the correct vessel map from the drop-down list.
Start by setting up a new control. Select well/s by marking them with the left mouse button while moving the cursor over the relevant well/s. It is possible to set several controls, e.g. for each cell line if more than one is used in the experiment – by using the Setup New Control button.
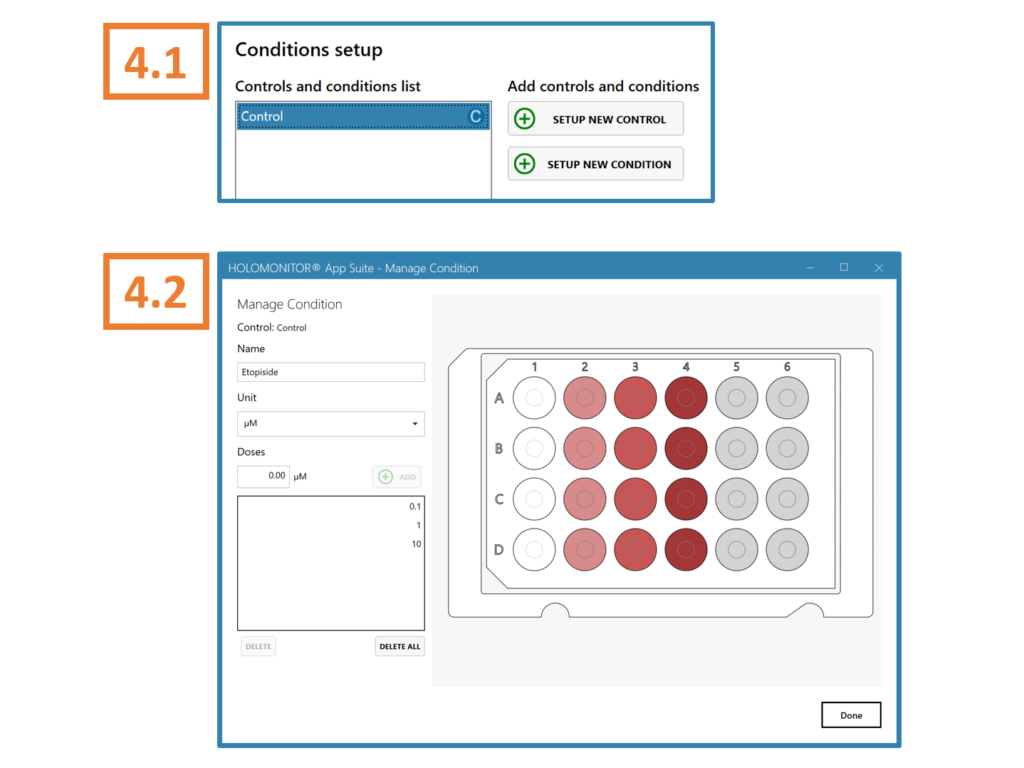
4.1 Select control in the Controls and Conditions list. Now, the Setup New Condition button gets activated. Click it to open the Manage Condition window.
4.2. Name the condition/ treatment and choose the drug unit. Select the well/s, type in the corresponding drug dose, and click Add/ Enter. Repeat for as many doses as needed for this drug. The color saturation of the wells is indicative of the dose concentration — the more saturated, the higher the dose. It is possible to add several different conditions, e.g. drugs, to the same control – by using the Setup New Condition button. The name of the condition needs to be unique.
Proceed to Capture setup.
Capture setup: Select the experiment time settings and choose capture positions
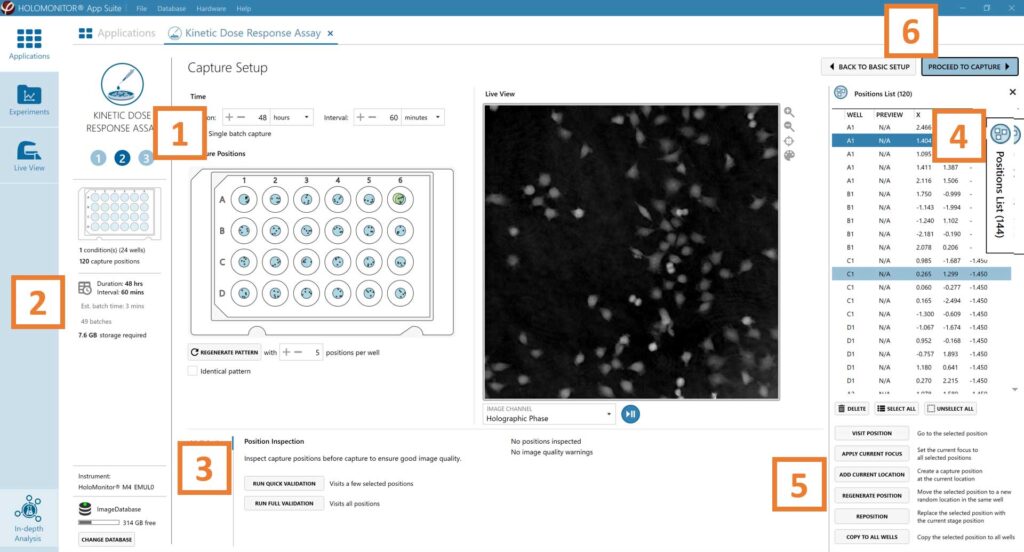
Adjust the default settings for the duration, interval and
the number of positions.
Ensure that the storage requirement for the experiment does not exceed the computer capacity.
► When running an experiment, data needs to be stored on the computer connected to the instrument. Storing data on an external drive (e.g. connected via USB or internet server) may cause data loss due to erratic USB connections or poor internet connection.
Run a full or quick validation of the selected positions to ensure good image quality.
Click the positions list button to view the position list.
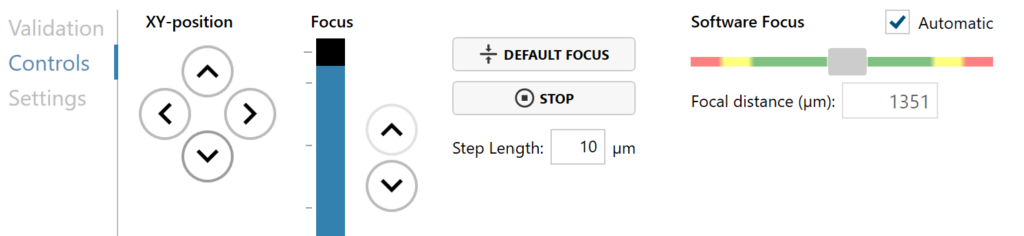
Inspect the images by hovering over the image icon in the list. Move the stage to that position by double-clicking the icon. If the image quality is poor, a warning sign appears. Adjust position location or focus if necessary.
When satisfied with the experiment setup, click Proceed to Capture.
Capture: Review the experiment in real-time during the time-lapse
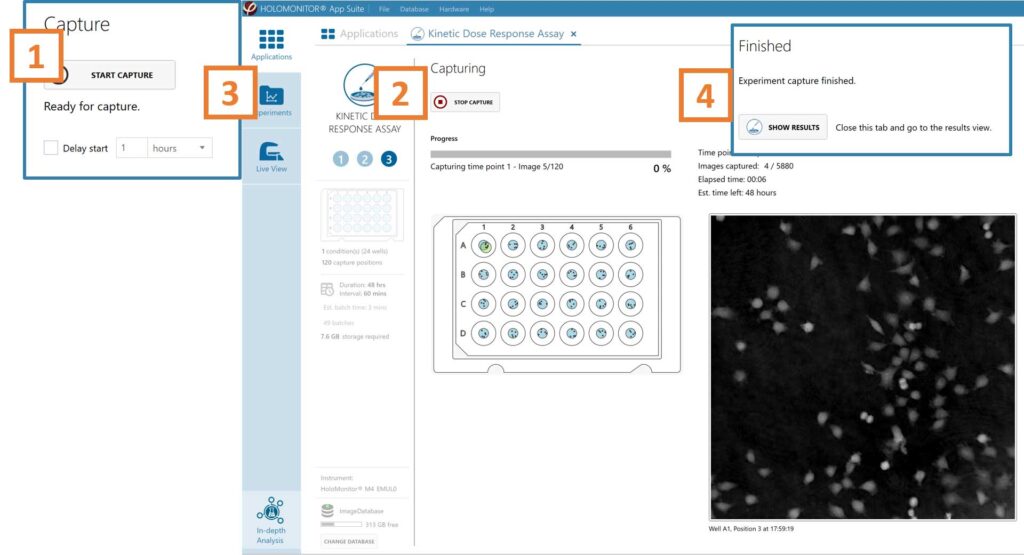
Click Start Capture.
To stop the experiment ahead of time, click the stop button.
► Note that it is NOT possible to restart the experiment once it has been stopped.
Go to the Experiments tab and open your ongoing experiment to preview the results during the run.
When the Experiment capture finishes, click the Show Result button to get directly to the Results page.
RESULTS & ANALYSIS
Experiments tab
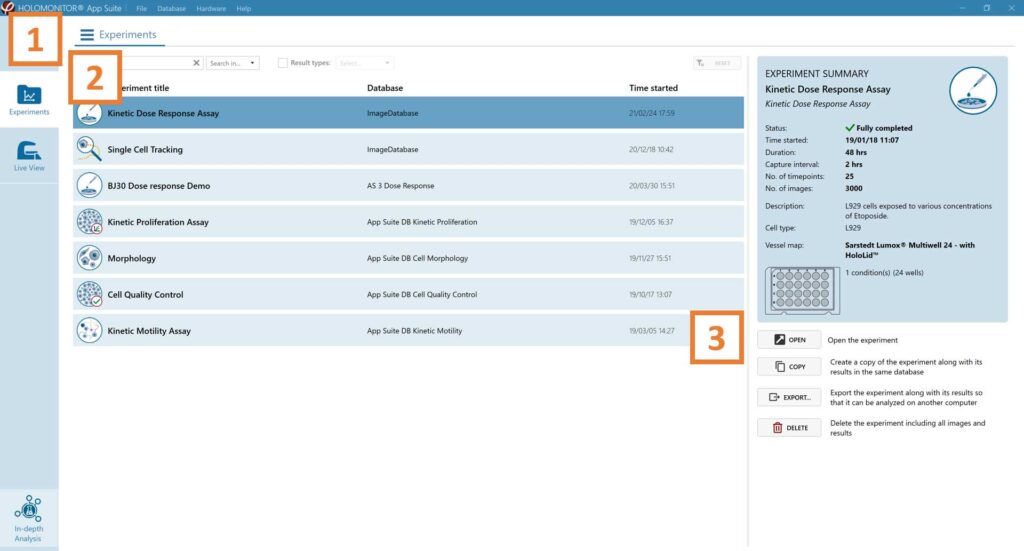
Click Experiments to see a list of the experiments.
Click on the experiment title to open an experiment summary.
Click Open to open the results page.
Experiment overview tab
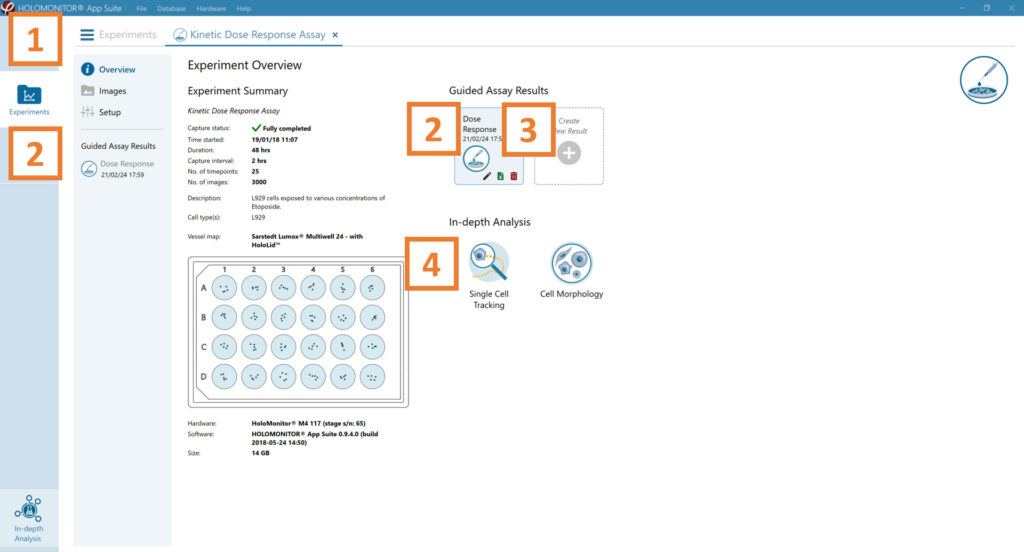
See the experiment summary, view all images, and go to
the experiment setup by choosing the respective tab.
Open the experiment data by clicking on the experiment result icon or its name in the Guided Assay Result list.
Create New Results from this experiment by clicking
the button.
Reach In-depth Analysis by clicking the respective icon.
Kinetic dose response data results tab
- The assay results are generated during image capturing.
- The software automatically analyzes quantitative data generated from each image.
- For a more detailed analysis all results can be exported.
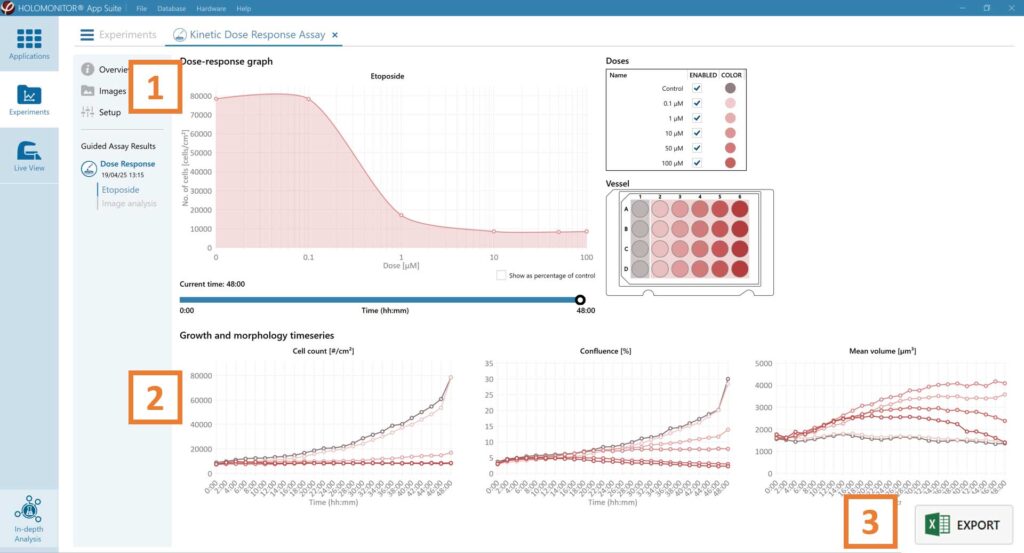
The results are given as an interactive Dose-Response curve with the time slider, which can be used to view the dose-response over the entire experiment time.
Additionally, cell count (#/cm2), confluence (%), and mean cell volume (µm3) graphs are depicted.
For further analysis, export all results to Excel. The exported data include population data based on means, including data for each captured position and standard deviations.
Image analysis tab

was correctly applied during analysis and the results are accurate.
- An image analysis algorithm filters out images of poor quality and excludes them from results data.
- Include or exclude images from results analysis. See the Image quality guide for more information.
The captured images from the experiment are displayed in a tree-view list. Clicking an item in the tree will show a list of all images contained in the selected level/category.
Checked checkboxes — all images are included.
Empty checkboxes — all images are excluded.
Checkboxes with a dash — some images are included.
Symbols in the list show cell analysis (yellow exclamation mark) or image quality warning (red exclamation mark).
It is possible to adjust the Sensitivity of image(s) and view the image threshold and markers.
The Advanced controls let the user adjust Threshold value, Threshold method and Min. cell size so the segmentation mask fits the holography signal. Choose which frames to apply the changes to in the dropdown meny and click Copy to apply the changes.
► Check cell segmentation for some images in the beginning, middle, and end of the experiment to make sure the applied threshold fits.
Once satisfied with the cell identification, click Apply changes to save the changes.
One experiment — multiple results
- This section helps to reanalyze data between different assays using HoloMonitor® App Suite software.
Generating In-depth Assay results
In the Experiment overview page select the In-depth application icon for the wanted result.
Follow the respective assay protocol.
Generating Guided Assay results
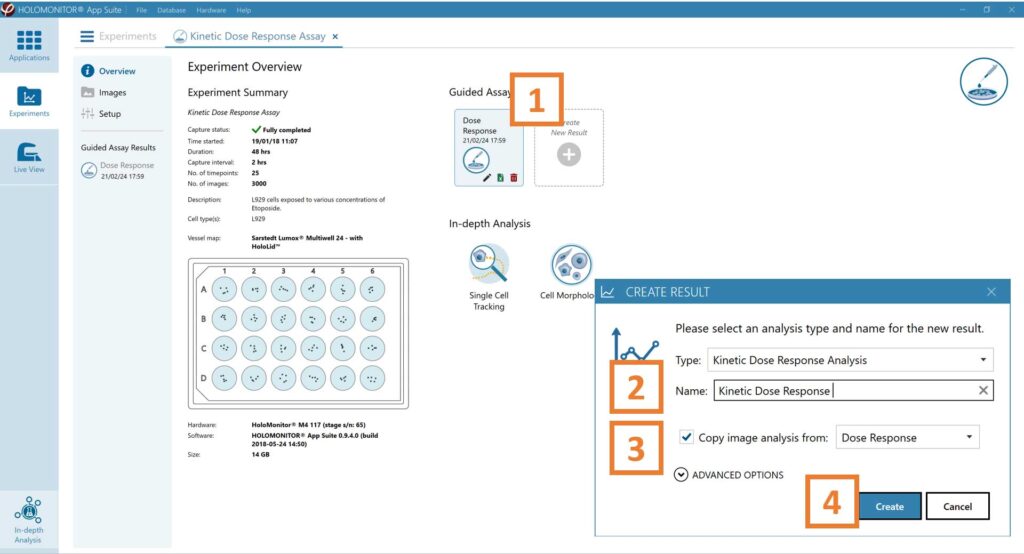
In the Experiment overview page under Guided Assay Results select Create New Result.
Choose the type of analysis in the pop-up window and name the new result.
Tick copy image analysis from and select the experiment to copy from. This will copy the image analysis settings from the selected result including all changes.
► For further data analysis steps, please see the respective assay protocol.
Press create.