Fluorescence Capture Protocol

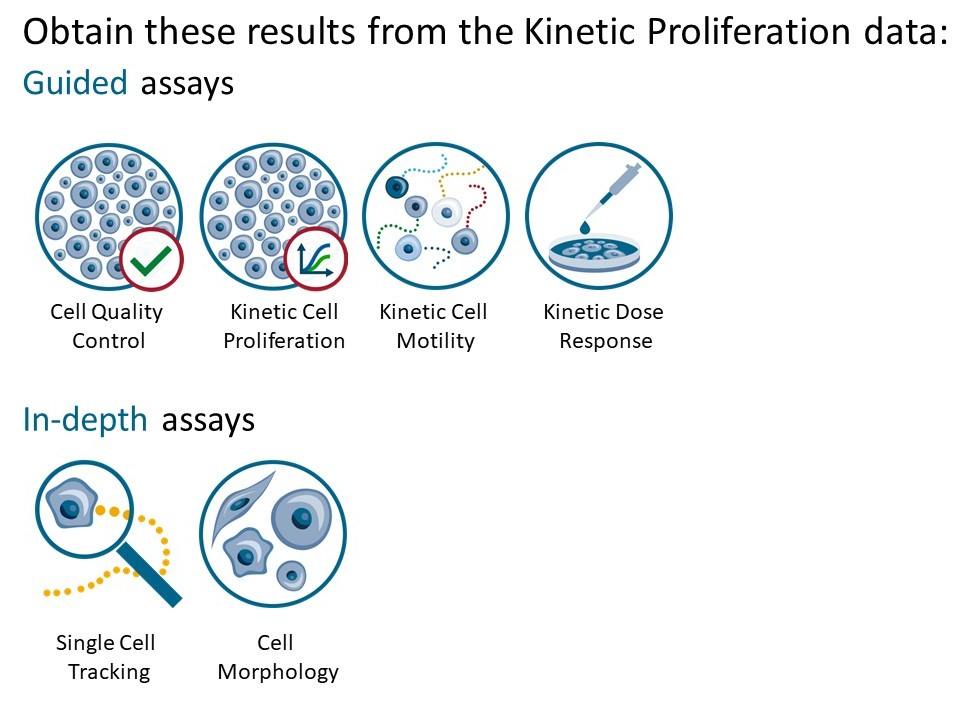
This protocol helps to set up a Fluorescence Capture using HoloMonitor® M4FL and the HoloMonitor® App Suite software. The HoloMonitor® Fluorescence Capture provides holography time-lapse images for further analysis by any other HoloMonitor® App Suite application and accompanying fluorescence images for Single Cell Tracking and Cell Morphology analysis.
Requirements:
- HoloMonitor® M4 with M4FL, placed in incubator
- HoloMonitor® M4 App Suite
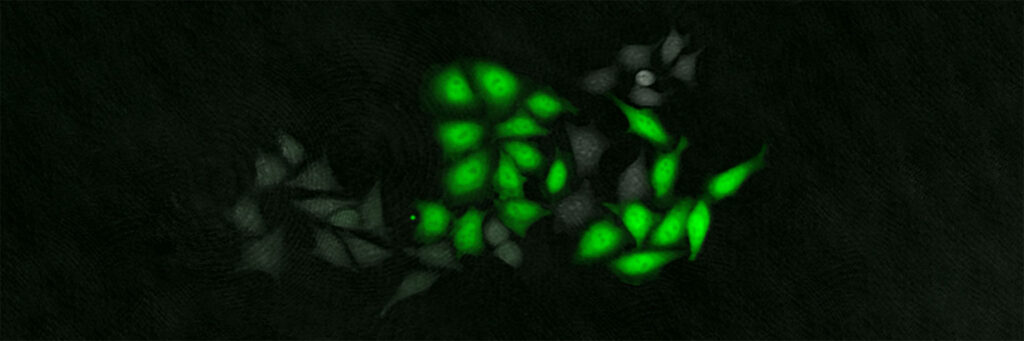
- Culture vessel of choice with cells, including fluorescent cells for positive control
- HoloLid™ for selected vessel
- Vessel holder for selected vessel
Output:
- Time-lapse images
- Time-lapse videos
- Fluorescence intensity values
- Selected application data analysis
Reanalysis:
- In-depth analysis
PREPARATIONS
Materials
- HoloMonitor® M4FL, placed inside the incubator
- HoloMonitor® App Suite software
- Cell culture vessel. Please check our list of recommended vessels.
- Cells, including a positive fluorescence control
- HoloLid™ for the selected vessel
- Vessel holder for selected vessel
- Setup and Operation Manual for HoloMonitor®
Steps
Seed the cells with about 5 % confluence (ca. 6000 – 11000 cells/cm2).
►Please note that too few cells may lead to inadequate results due to auto-focus failure.
►Please note that a positive fluorescent control that
is representative of your exmeriment set up is essential.
Place the vessel in the incubator and let cells attach for 2-24 hours.
Start the software and wait for complete instrument initialization.
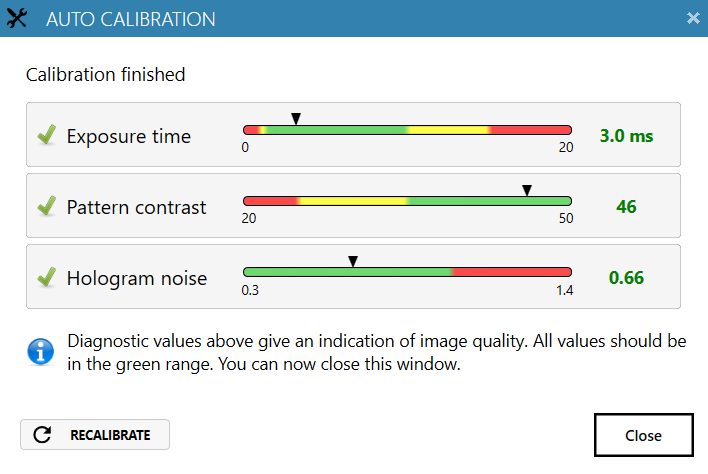
Run an auto-calibration. With successful calibration (as shown in the picture), the instrument is ready to use.
| Vessel |
Vendor cat. number | HoloLid™ |
Final working volume |
Growth area, cm2/well |
Vessel cut in a holder |
| Sarstedt TC-dish 35 | 83.3900 | 71110 | 3.0 mL/well | 8.00 | NA |
| Sarstedt TC 6-well plate | 83.3920.005 | 71120 | 3.0 mL/well | 8.80 | top left |
| Sarstedt lumox® 24-multiwell plate | 94.6000.014 | 71130 | 1.9 mL/well | 1.90 | top left |
| Sarstedt lumox® 96-multiwell plate | 94.6000.024 | 71140 | 170 µL/well | 0.34 | top left |
| ibidi® μ-dish 35 mm, high | 81156 | 71111 | 2.5 mL/well | 3.50 | NA |
| ibidi® μ-plate 24 Well Black | 80241 | 71131 | 2.5 mL/well | 1.90 | NA |
| Eppendorf CCCadvanced® FN1 – 6 well | 0038110010 | 71150 | 3.0 mL/well | 9.40 | bottom right |
Sterilize the HoloLids™ according to the specific HoloLid™ protocol.
Add the treatment to your cells. The final working volumes per well, essential for using HoloLids™, are shown in the table above.
Slide the cell culture vessel onto the Vessel holder, its grips facing towards you. Ensure that the vessel is parallel to the holder. There is a spring that holds the vessel in place.
►When using multi-well plates, place them with the cut-off corner to the left.
Replace the standard lids with the HoloLid™.
Put the vessel holder with the sample on the HoloMonitor® M4 stage.
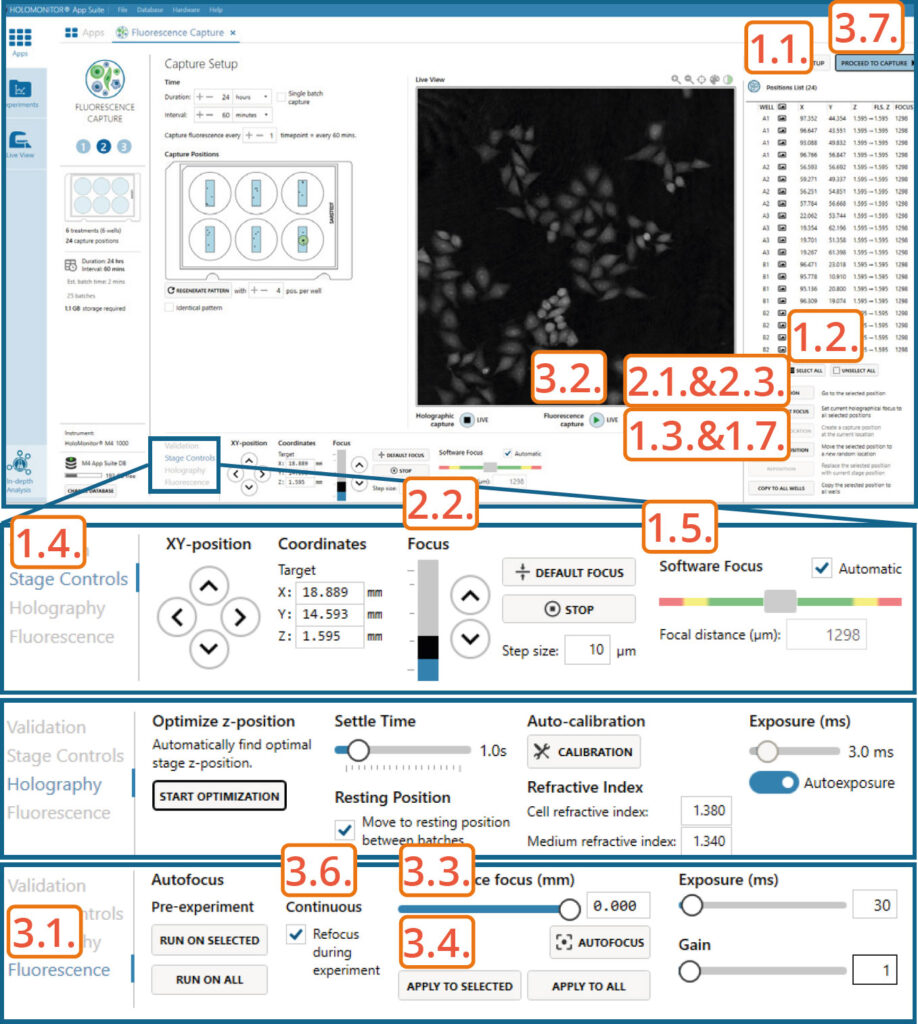
CALIBRATING FLUORESCENCE SIGNAL IN LIVE VIEW
Focus Holography image
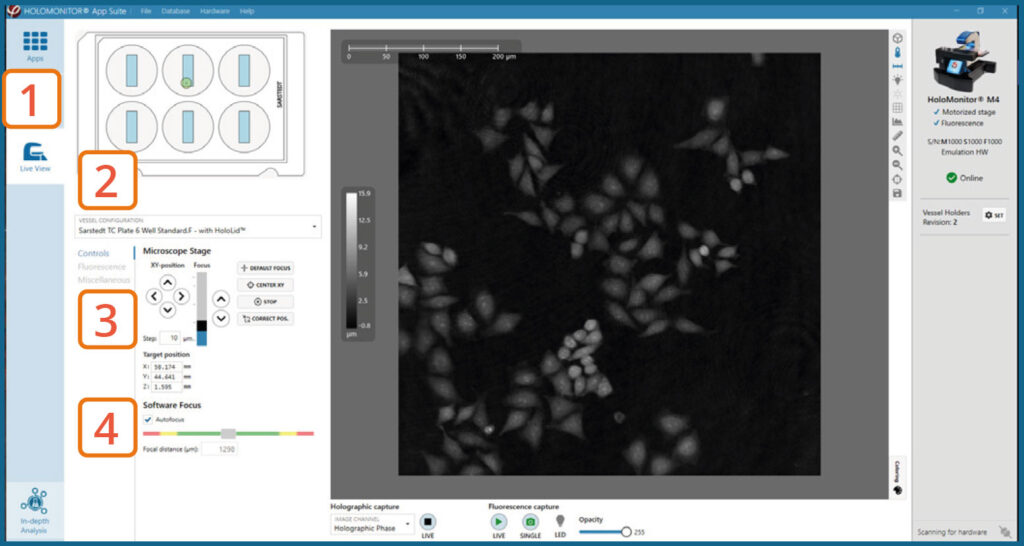
Go to Live View Tab on the left side panel.
Select the correct vessel map from the drop-down list.
Find a position with cells. Preferably, the position should be as centered in the vessel as possible.
In Controls, make sure that the holography image of the cells is in focus by adjusting the Z-position of the stage using the up/down arrows. Ensure that Autofocus is ticked and then adjust the Z-position until the Software focus bar shows 1300±5.
► The Z-position will be saved with the calibration and used as the default Z-position during Capture Setup.
Calibrate Fluorescence Focus Plane
Go to the Fluorescence tab.
Turn on Fluorescence live capture by pressing the Play button (or take a Single image repeatedly) while manually adjusting the Fluorescence focus until you get a fluorescence signal.
► You can use the arrow keys on the keyboard.
Check that the view is set to mixed channel.
Set Exposure time and Gain. For more information see HoloMonitor® M4FL Setup and Operation Manual.
► Increasing gain value might be beneficial when the fluorescence signal is weak, and App Suite struggles to find focus automatically.
Press Autofocus to automatically set best focus offset.
If the software fails to find optimal focus, adjust it manually by adjusting the fluorescence focus slider.
Press Calibrate.
Use the Position, Scale and Rotation controls to adjust and align the fluorescence overlay to fit the holographic image.
► This is an iterative step. Thus, position, scale, and rotation adjustments do not need to be performed sequentially.
► If needed, you can decrease the Step size to make finer adjustments. You can also change the opacity of the fluorescence overlay to compare it with the holographic image better.
Turn Off the Fluorescence Live Capture.
Press Save calibration when the fluorescence focus and alignment are as good as possible.
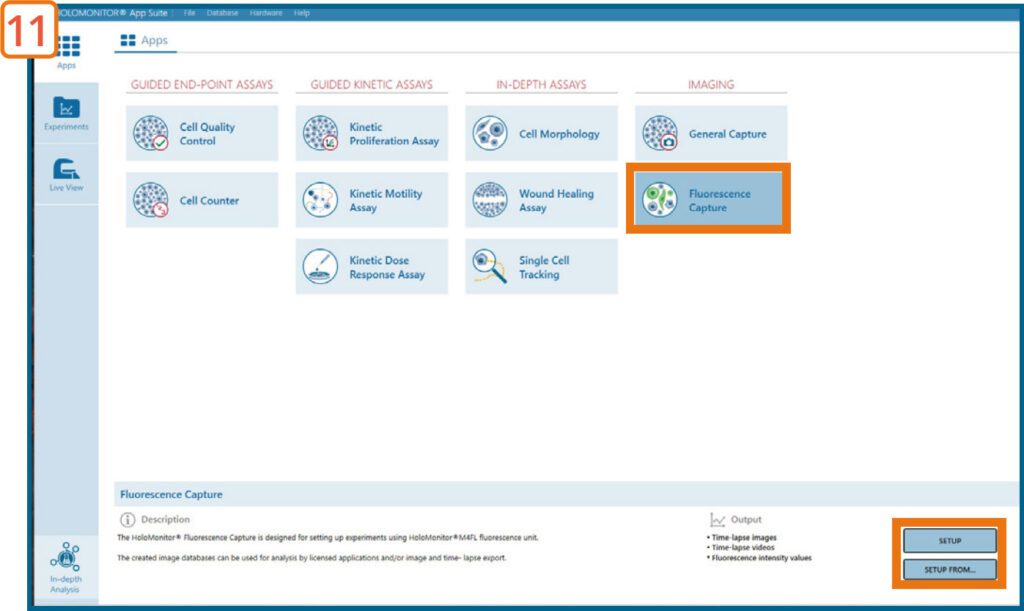
Go to the Apps tab and select the Fluorescence Capture Application and proceed by clicking the Setup button.
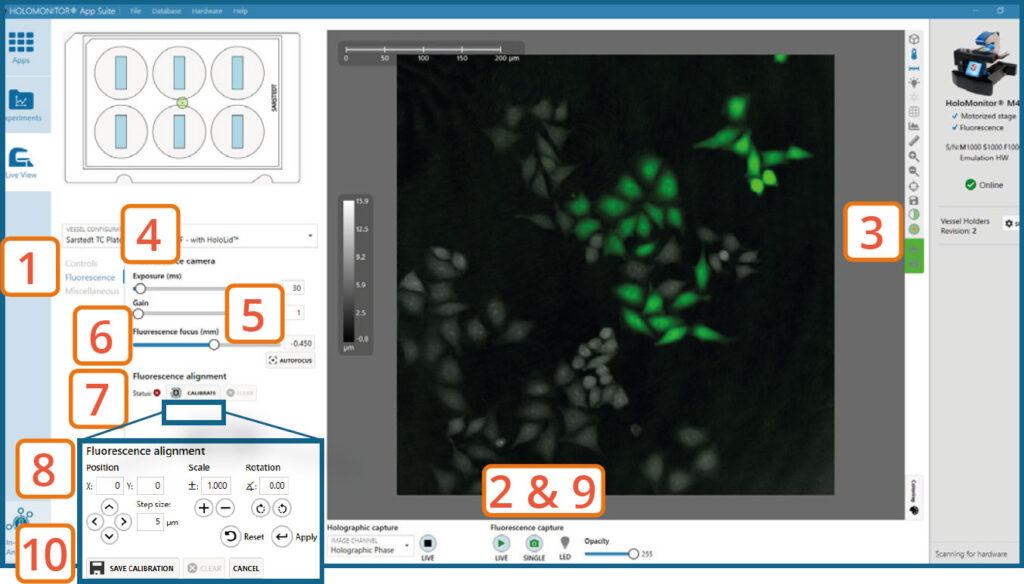
Fluorescence signal intensity can be evaluated using the measure tool (or histogram), which are found to the right of the Live View image.
To reduce the fluorescent exposure during calibration, turn off fluorescence live capture. Instead, take a single fluorescence image every time you need to confirm a change during the calibration.
If the arrows in Controls for Microscope Stage were used in
step 1.3 to navigate to the location used for calibration, the
holographic position might need to be corrected:
Go to Controls.
Turn OFF the Holographic Phase channel by p ressing the Stop button .
Press Correct Pos.
Turn ON the Holographic Phase channel by pressing the Play button.
Turn OFF the Holographic Phase channel by pressing the Stop button.
Take Single Fluorescence Capture.
Check if Holographic Channel and Fluorescence Channel images are aligned. Repeat steps if needed.
EXPERIMENT SETUP
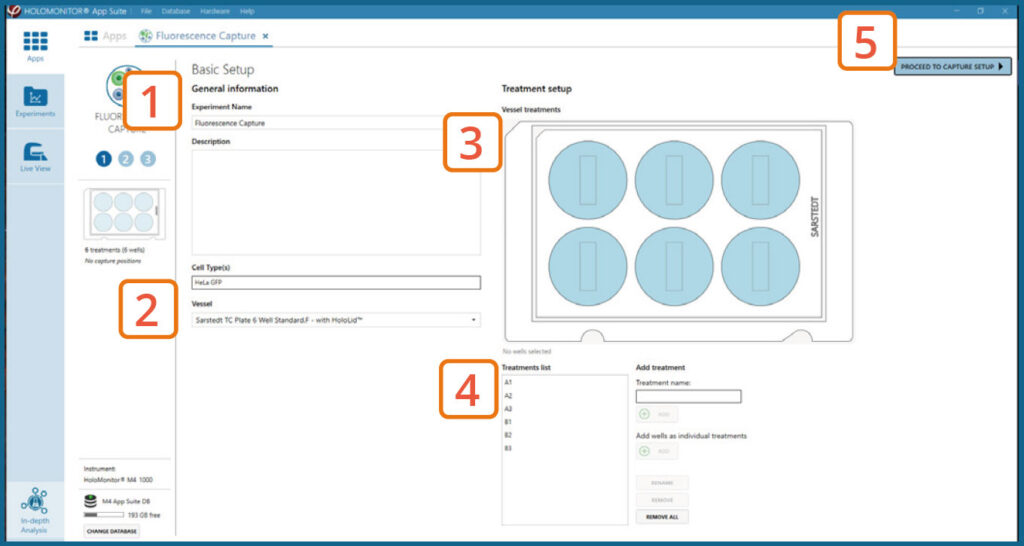
Basic setup: Describe the experiment and assign treatments to the wells
Enter the experiment name, optional experiment description, and cell types.
Select the correct vessel map from the drop-down list.
Map treatments on the vessel map. Select wells by
marking them with the left mouse button while moving
the cursor over the relevant well(s).
Add the treatment name(s) in the text box below the vessel map and click Add / press Enter. It is possible to
add wells as individual treatments. Marked well(s) are light blue, selected wells will appear dark blue.
Proceed to Capture setup.
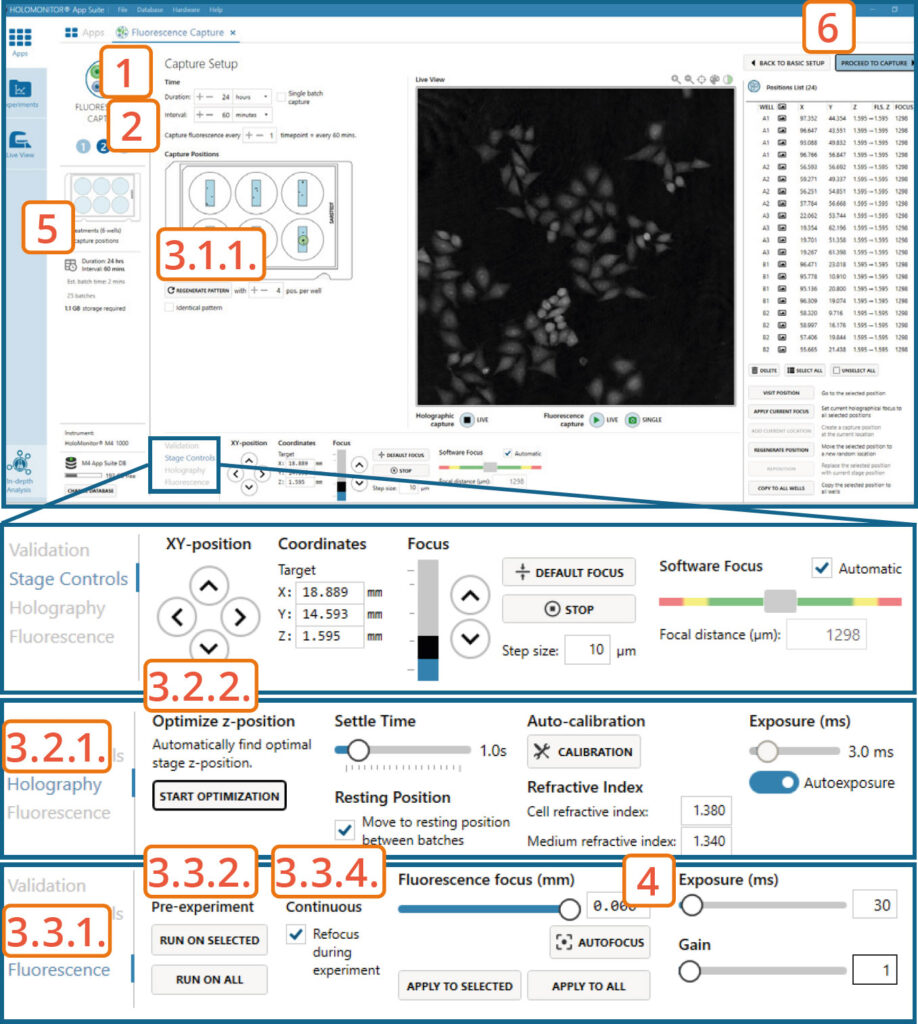
Capture setup: Set experiment time settings, choose and validate capture positions
Adjust the default settings for duration and interval.
Set Fluorescence capture interval.
► Captures set too often will induce phototoxicity.
Setup capture positions.
Setting capture locations:
Use the software automatically pre-set positions, change the number of positions if needed by pressing the Regenerate pattern button.
If automatically generated positions are not suitable, find and set the positions manually (see Capture Setup: Manually choose and validate capture positions section).
Setting Holographic focus:
► This step can be skipped if the Holographic Software focus was set manually to 1300±5.
Go to the Holography tab.
Automatically optimize the Z-position by pressing the Start Optimization button. The software automatically tries to set a Z-value, where the Software focus would be as close as possible to 1300±5. Values for the inspected positions are displayed in the Position list.
► This function also validates the image quality. For more information about image quality, consult App Suite Setup and Operation Manual.
If the Automatically set Z-value does not lead to a Software focus of 1300±5, adjust the Z-value manually (see Capture Setup: Manually choose and validate capture positions section).
Setting Fluorescence focus:
Go to the Fluorescence tab.
To automatically adjust the Fluorescence focus value for selected positions that have fluorescence signal at the beginning of the capture or all positions, press Run on Selected or Run on All under Autofocus Pre-experiment.
► This step can be skipped for positions/wells where the fluorescence signal appears later during the capture.
To manually adjust the Fluorescence focus value for the selected position or all positions, see Capture Setup: Manually choose and validate capture positions section.
Enable Continuous Refocus during experiment for the software to adjust Fluorescence focus during the capture.
Adjust the fluorescence exposure time and gain if needed in the Fluorescence tab.
Ensure that the storage requirement for the experiment does not exceed the computer capacity.
When satisfied with the experiment setup, click Proceed
to Capture.
For the best Fluorescence imaging result, the Holographic Image Software focus value should be as close as possible to 1300±5. Adjusting the Actual Z-value for each position might be necessary.
Capture setup: Manually choose and validate capture position
Setting capture locations:
Click the positions list button to view the list.
Press the Select all button and Delete to remove automatically generated positions.
Press Add Current Location to add Fluorescence calibration position if wanted.
Find a position with cells using arrows in Stage Controls or by clicking on the vessel map.
Adjust the Z-value to the position where the Software focus is 1300±5.
If satisfied, press Add current location.
Repeat until satisfied.
Setting Holographic focus:
Visit the position.
Change position Z-value using Focus arrows in Stage Controls. Once the Software focus is 1300±5, press Apply Current Focus.
If satisfied, proceed to the next position. Otherwise, find a new location.
Setting Fluorescence focus:
Go to the Fluorescence tab.
Start Fluorescence live feed.
Use Fluorescence focus slider to achieve the sharpest fluorescence image.
Once satisfied, press Apply to Selected or Apply to All.
Repeat for other positions if needed until satisfied.
Enable Continuous Refocus during experiment for the software to adjust Fluorescence focus during the capture.
Click Proceed to capture.
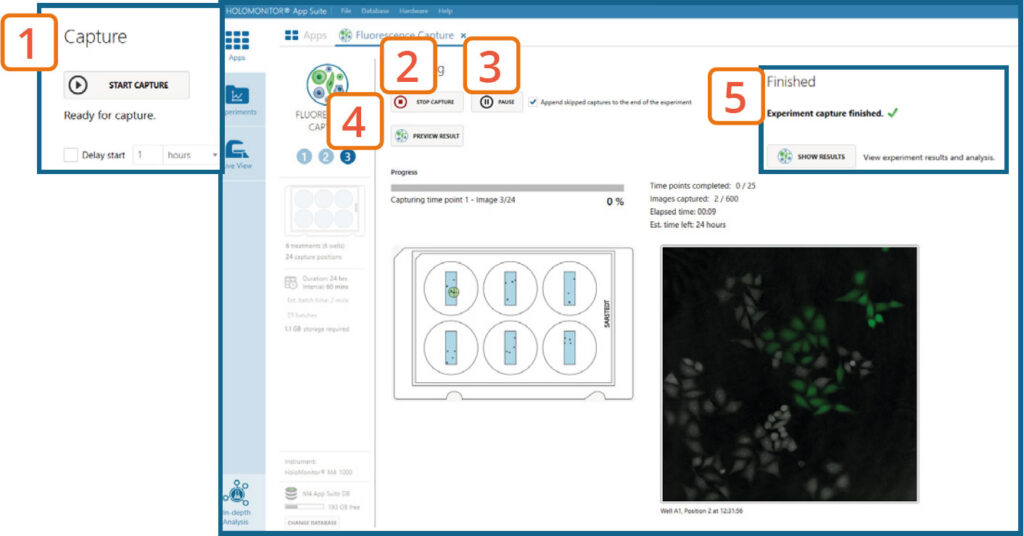
Capture: Review the experiment in real-time during the time-lapse
Click Start Capture.
To stop the experiment ahead of time, click the Stop Capture button.
► It is not possible to restart the experiment once it has been stopped.
To pause the experiment, click the Pause button. Press Resume button to continue the experiment.
► Missed frames can be appended to the end of the experiment or skipped.
Click on Preview Results to preview the captured images during the run.
►Wait for the experiment to fully finish before starting data analysis.
When the Experiment capture finishes, click the Show Result button to go directly to the Experiment Overview tab.
RESULTS & ANALYSIS
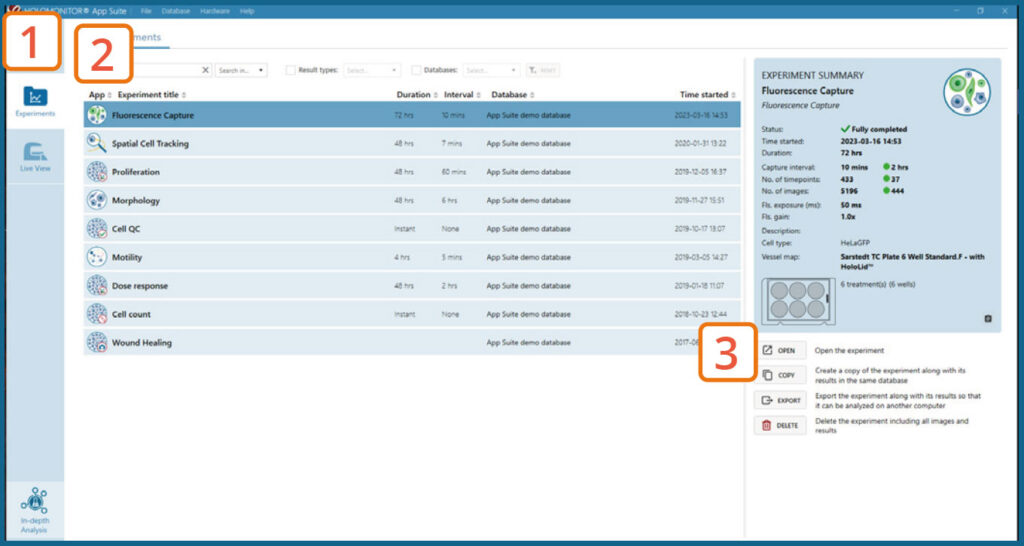
Experiments tab
Click Experiments to see a list of the experiments.
Click on the experiment title to open an experiment summary.
Click Open or double-click left mouse button to open the results page.
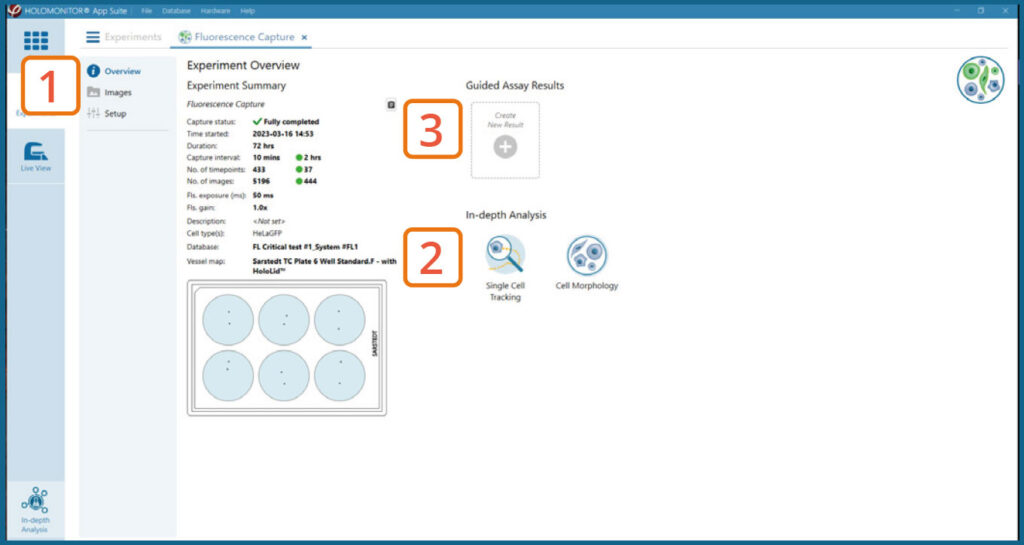
Experiment overview tab
See the experiment summary, view all images and go to the experiment setup.
Generate In-depth analysis data (fluorescence green area (μm2), fluorescence green average, fluorescence green max, fluorescence green min, fluorescence green std, and fluorescence green sum) from the captured images by clicking on the Cell Morphology or Single Cell Tracking icon. A new window for the In-depth analysis will open.
Create New Guided Assay Results from this experiment by clicking the button.
► Note that only the DHM images will be analysed using the guided assay analysis.
In-depth analysis
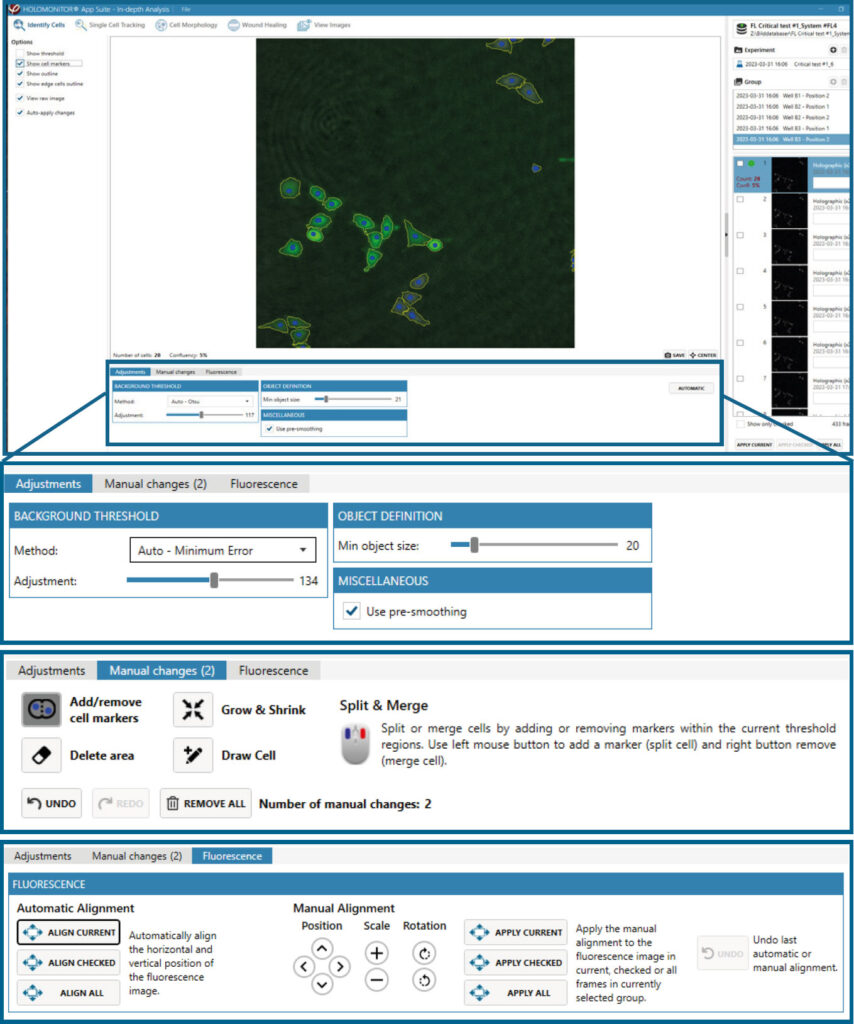
- The first step for Cell Morphology analysis and Single Cell Tracking is to identify the cells.
- The software automatically calculates cell count and confluence for each image.
- Review the image quality and include/ exclude images from results analysis. See the Image guide for more information.
- In the Identify cells under Fluorescence tab, adjust Holographic and Fluorescence Image overlay automatically or manually for individual frames, selected frames, or all frames.
- Follow corresponding Cell Morphology or Single Cell Tracking application protocols for data analysis.
One experiment — multiple results
- This section helps to reanalyze data between different assays using HoloMonitor® App Suite software.
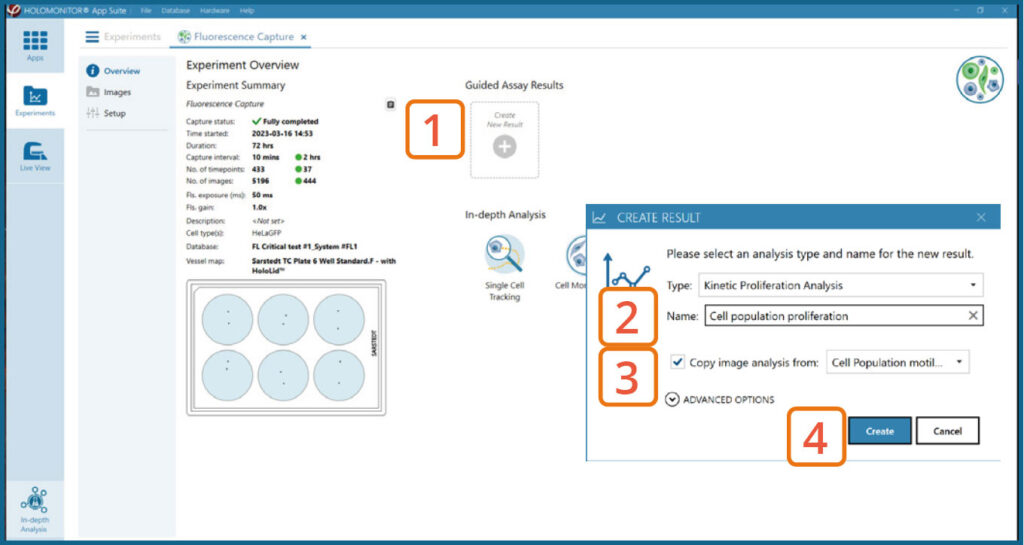
Generating Guided Assay results
In the Experiment overview page under Guided Assay Results select Create New Result.
Choose the type of analysis in the pop-up window and name the new result.
If there are previous analyses it is possible to tick copy image analysis from and select the experiment to copy from. This will copy the image analysis settings from the selected result including all changes.
► For further data analysis steps, please see the respective assay protocol.
Press create.
Generating In-depth Assay results
In the Experiment overview page select the In-depth assay icon for the wanted result.
Follow the respective assay protocol.