Image Quality Guide
This image guide intends to assist HoloMonitor® M4 users when evaluating image quality during experiment setup and result analysis. Please contact support@phiab.com if you need further assistance assessing image quality.
EXPERIMENT SETUP
Before you start
Check the status of your cells: image a maximum of 80% confluency in a field of view to allow the software algorithm to identify individual cells from the background. HoloMonitor® M4 is designed to visualize and quantify adherent monolayer cell cultures, therefore your cells should not grow in multiple layers or in suspension cell culture.
Always perform Auto-calibration before every experiment. The calibration minimizes background noise.
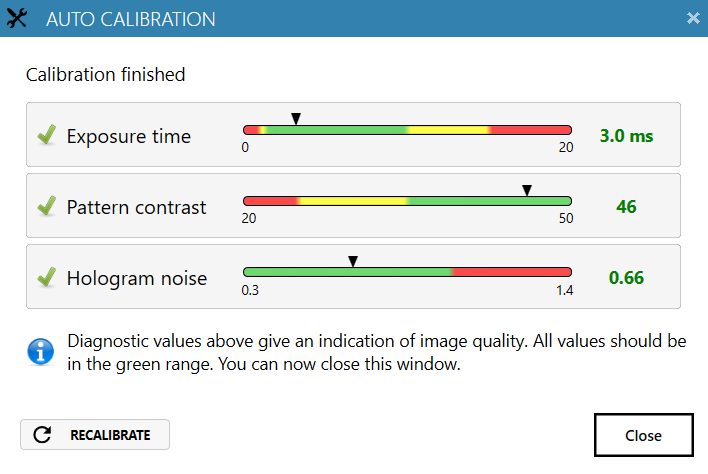
heads) should be in the green range.
Reasons for failed auto-calibration:
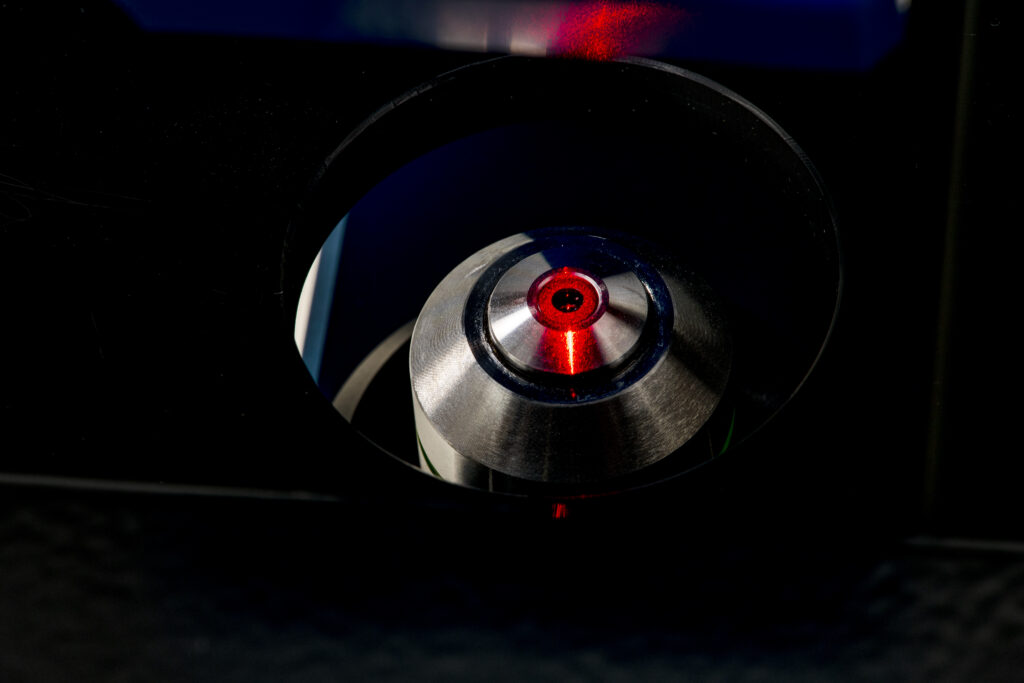
- If all values are in the red region – the laser does not produce enough light. Reasons: dirty optics, laser being not properly connected or dirty, laser requires periodical recalibration. For resolving issues, consult the Setup and Operation Manual.
- If Hologram noise is in the red range – HoloMonitor® M4 might have dirt on the optics or dirt inside the instrument. Clean the objective, if the problem persists, contact technical support (by writing email to support@phiab.com) for further assistance.
During Capture Setup
Inspect the images when setting up the capture for the experiment. Run a full or quick validation to ensure good image quality. If the image quality is poor, a warning sign (yellow exclamation mark) appears.
Having cells grow too sparsely may introduce image analysis warnings. Make sure there are at least a few cells in the field of view. Adjust the capture position location if necessary.
Reasons for poor image quality could be: incorrect focus, condensation, dirt and particles, air bubbles, smears and scratches, or the vessel’s optical properties.
Below are examples of poor quality images prompted due to various reasons.
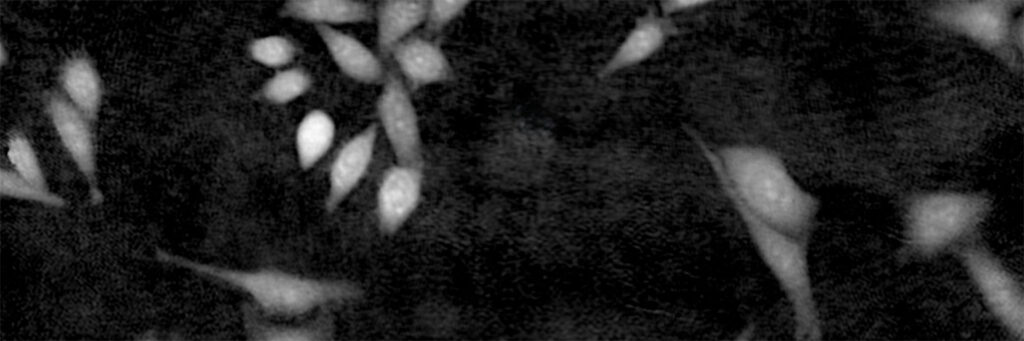
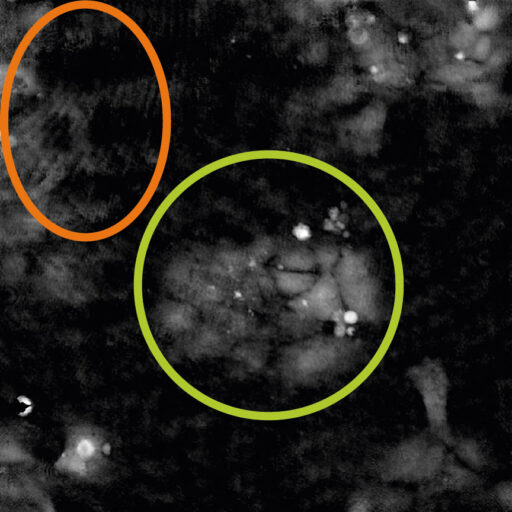
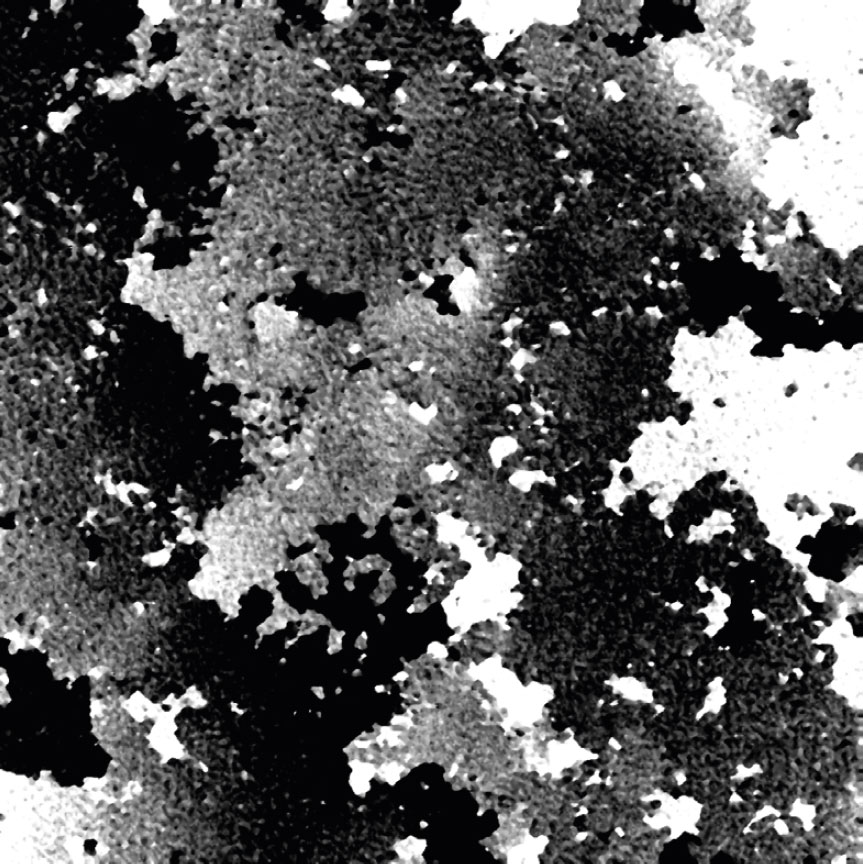
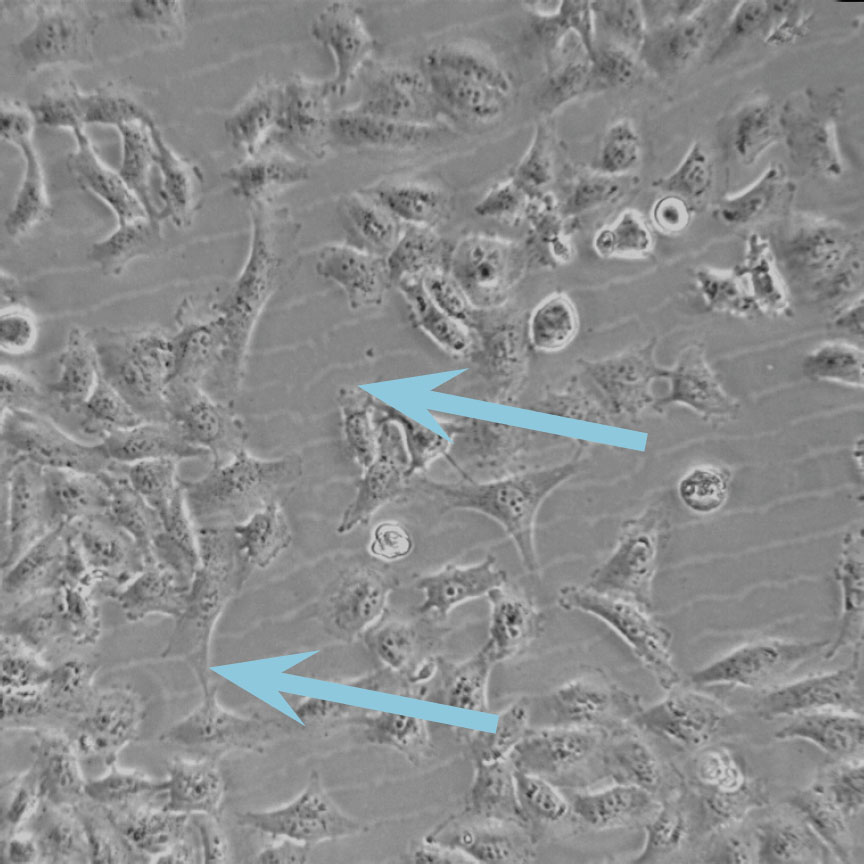
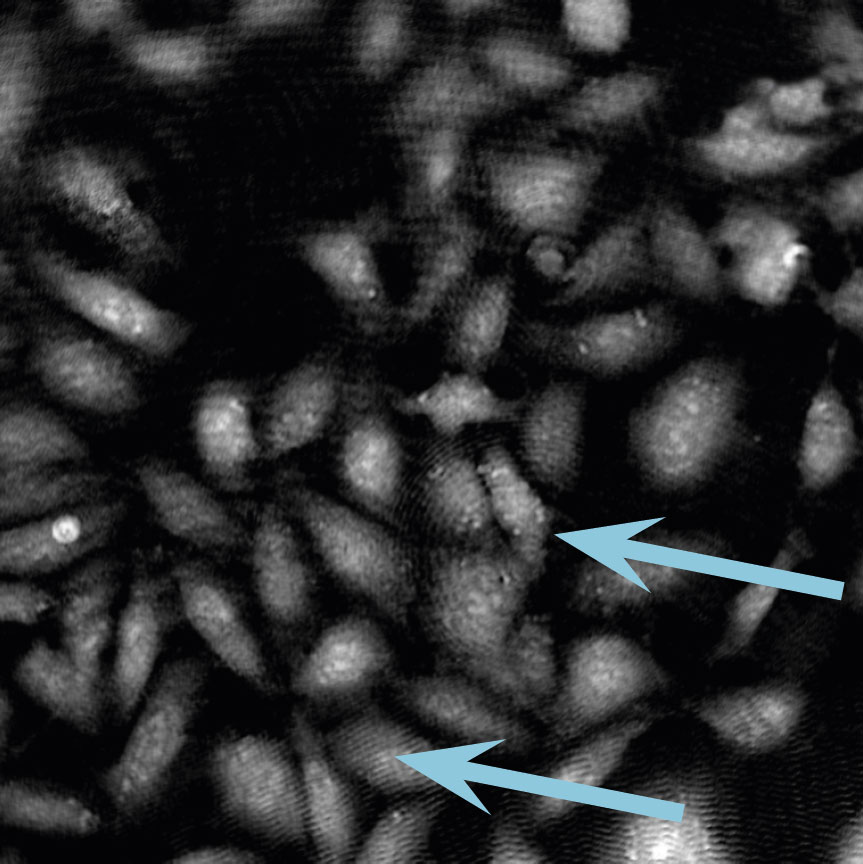
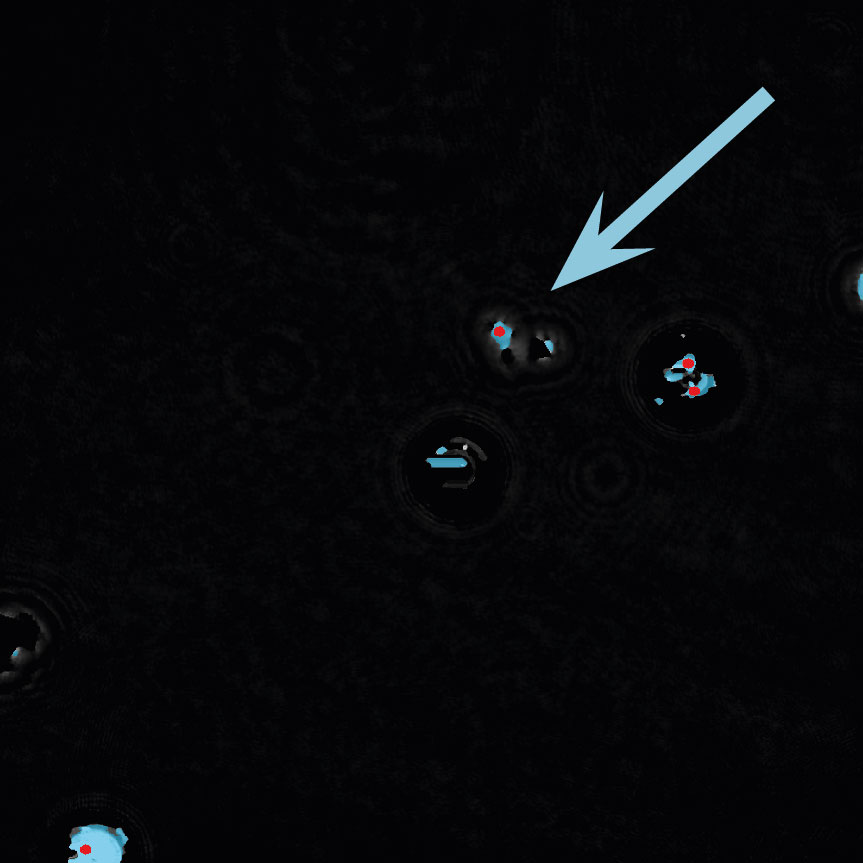
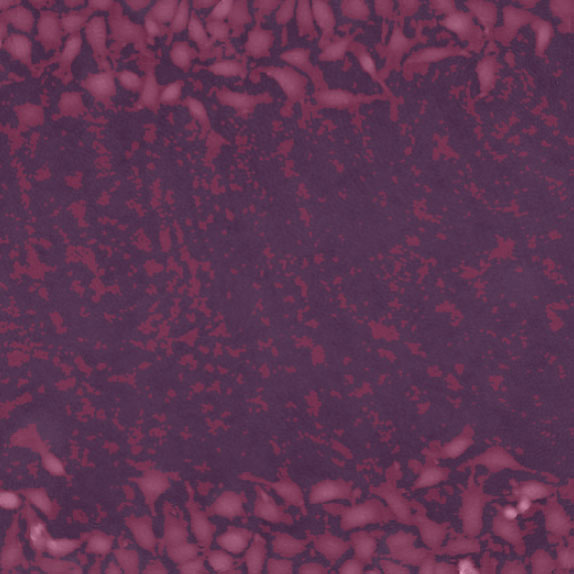
Cell are growing in multilayers or in suspension
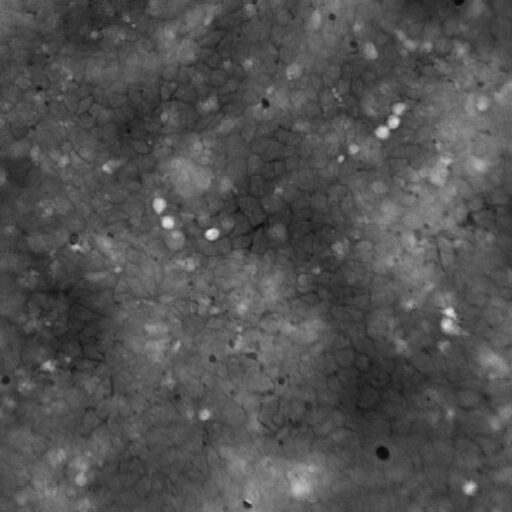
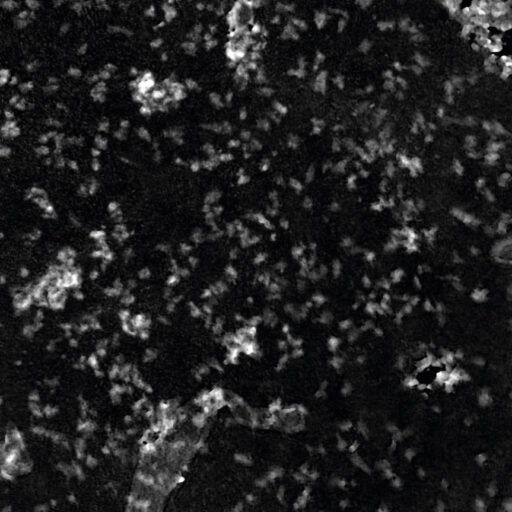
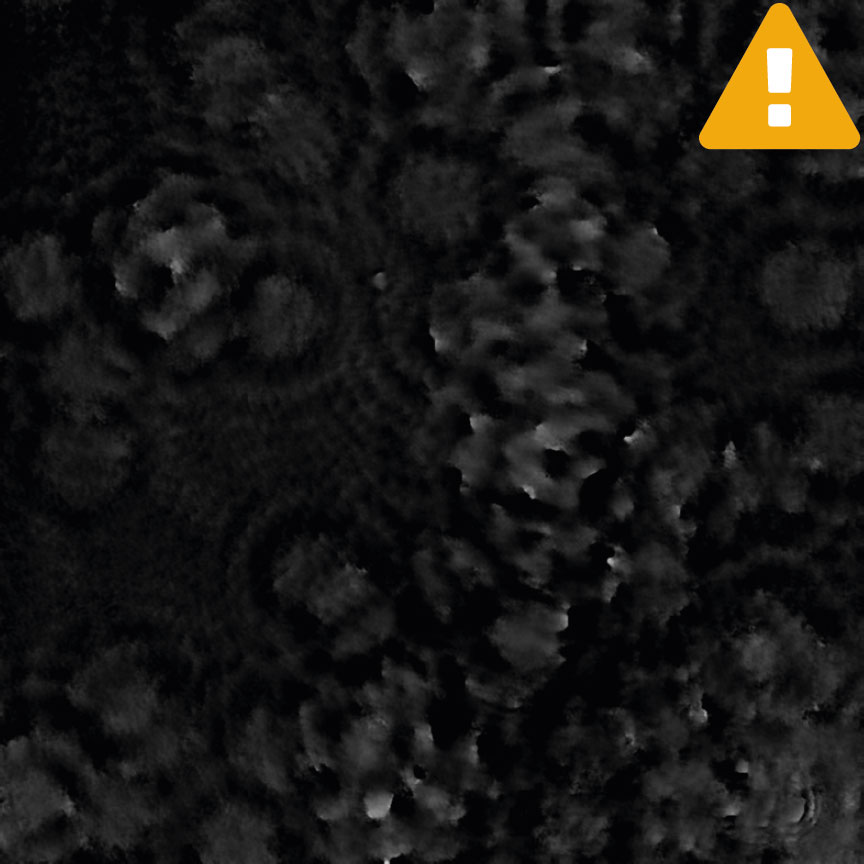
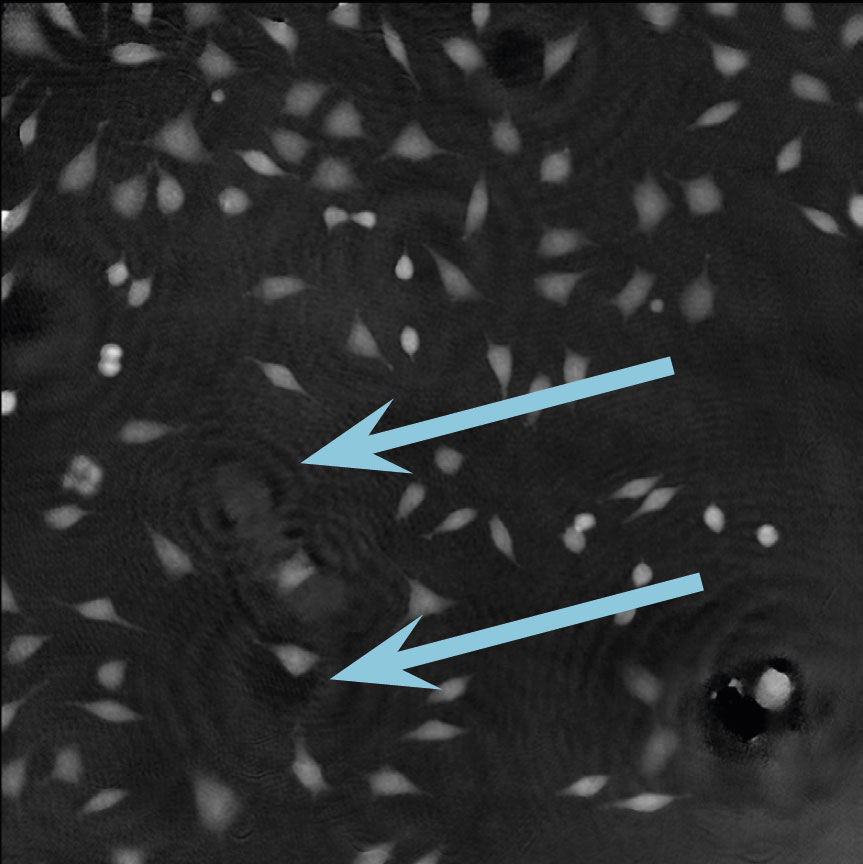
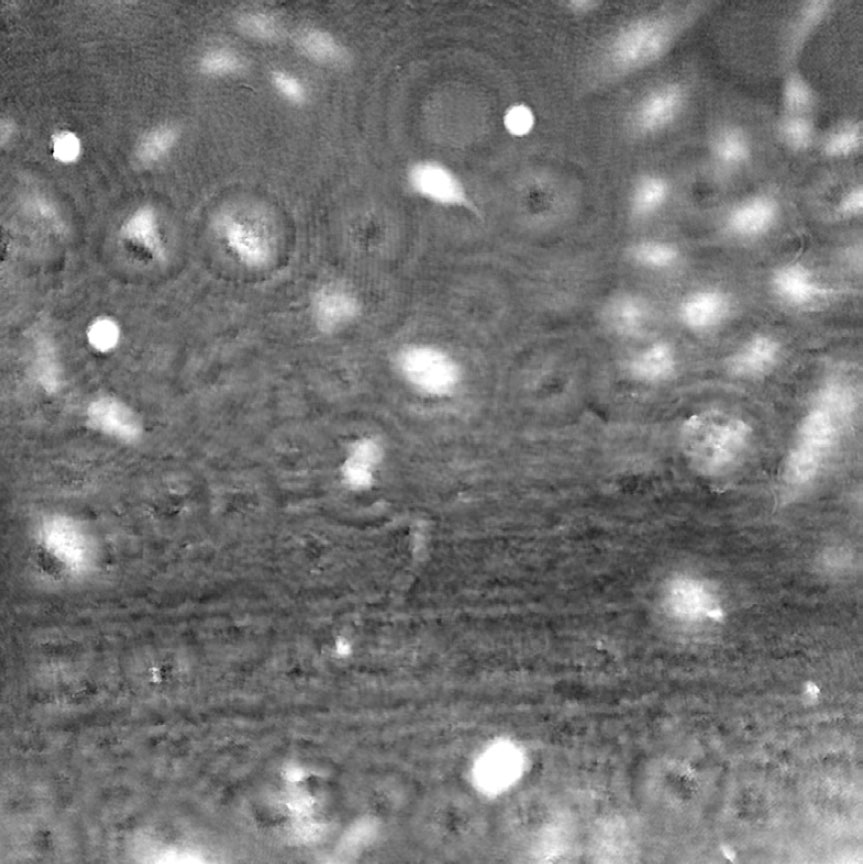
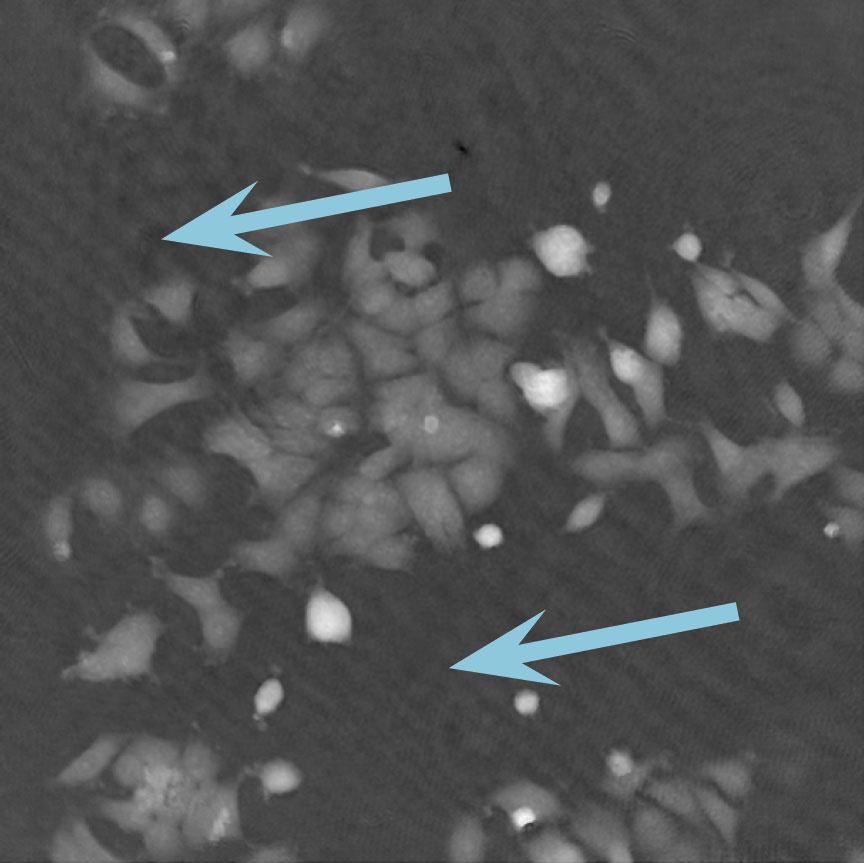
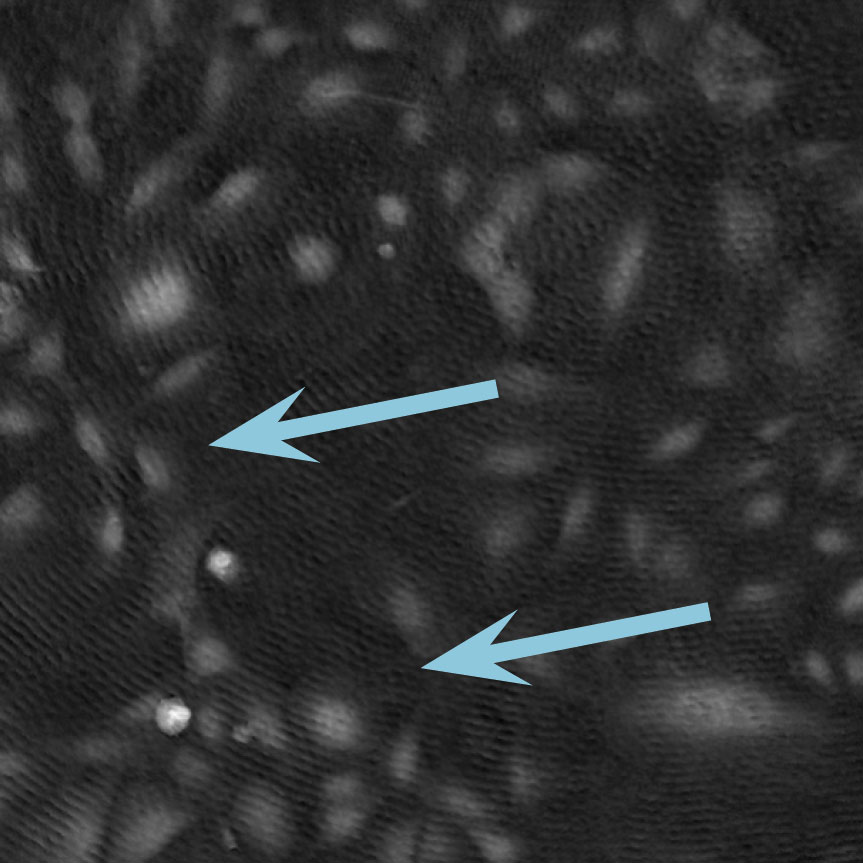
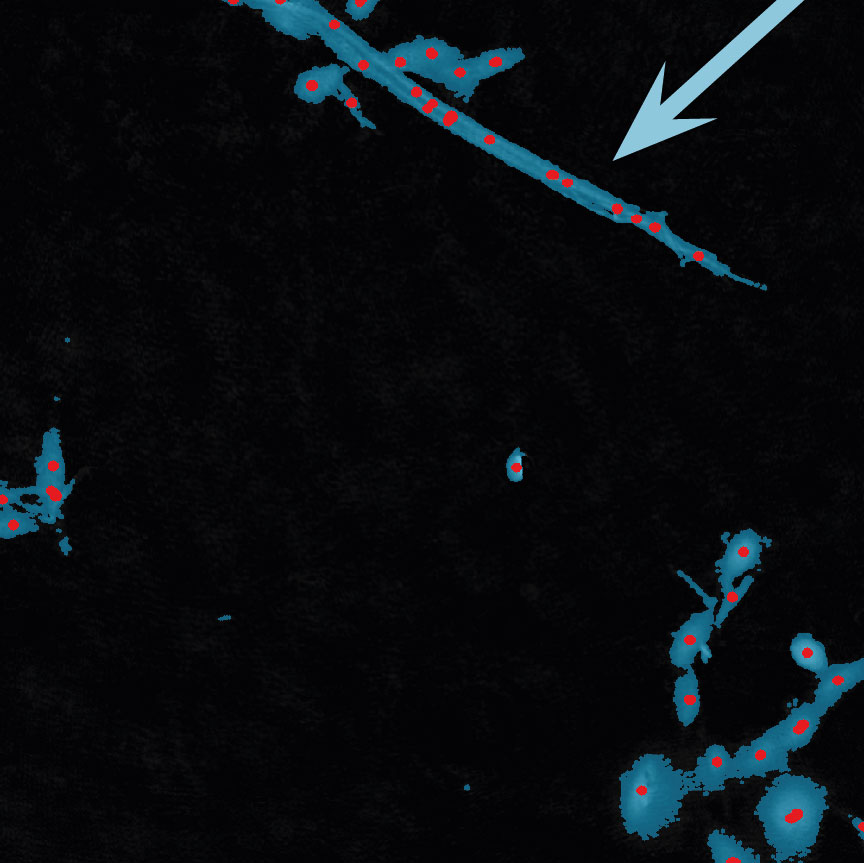
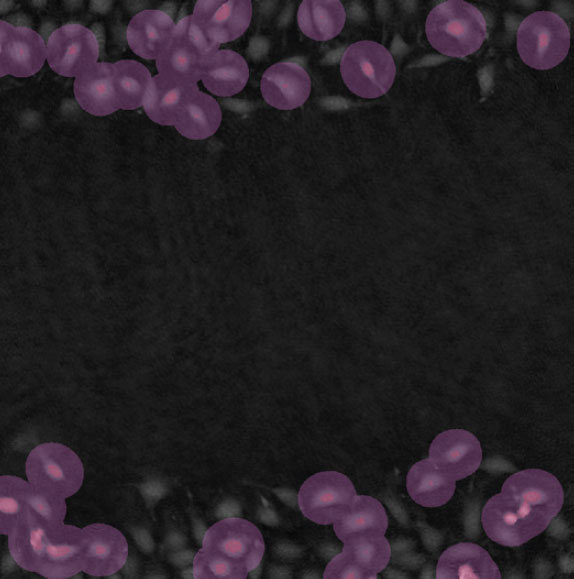
High background noise
A minimal background noise is especially important when working with
very thin cells to distinguish cells from a strong background noise.
Incorrect focus
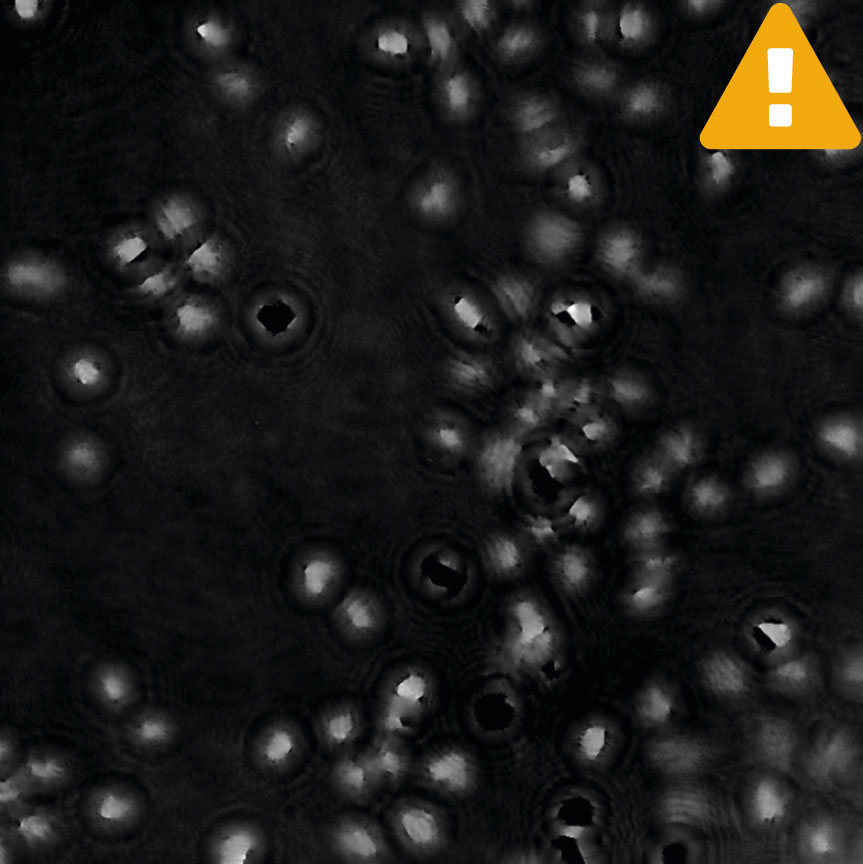
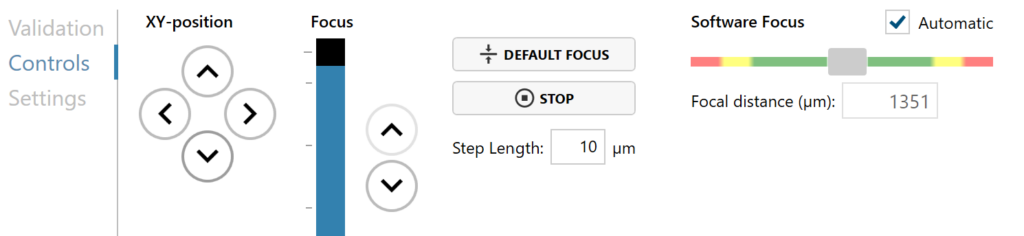
MANUAL FOCUS ADJUSTMENT: The focusing tool is located in the Controls tab. Move the black square or click on the Arrow buttons to move the stage up and down. Save an adjusted focus setting to the selected position by using the Apply Current Focus button. For details, consult the Setup and Operation Manual.
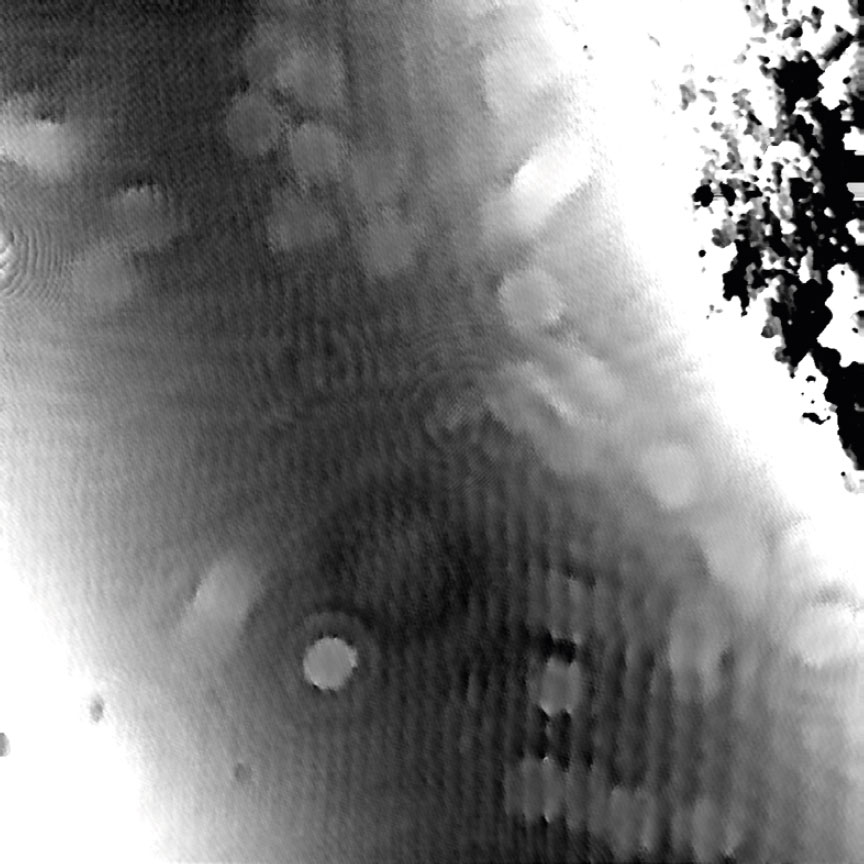
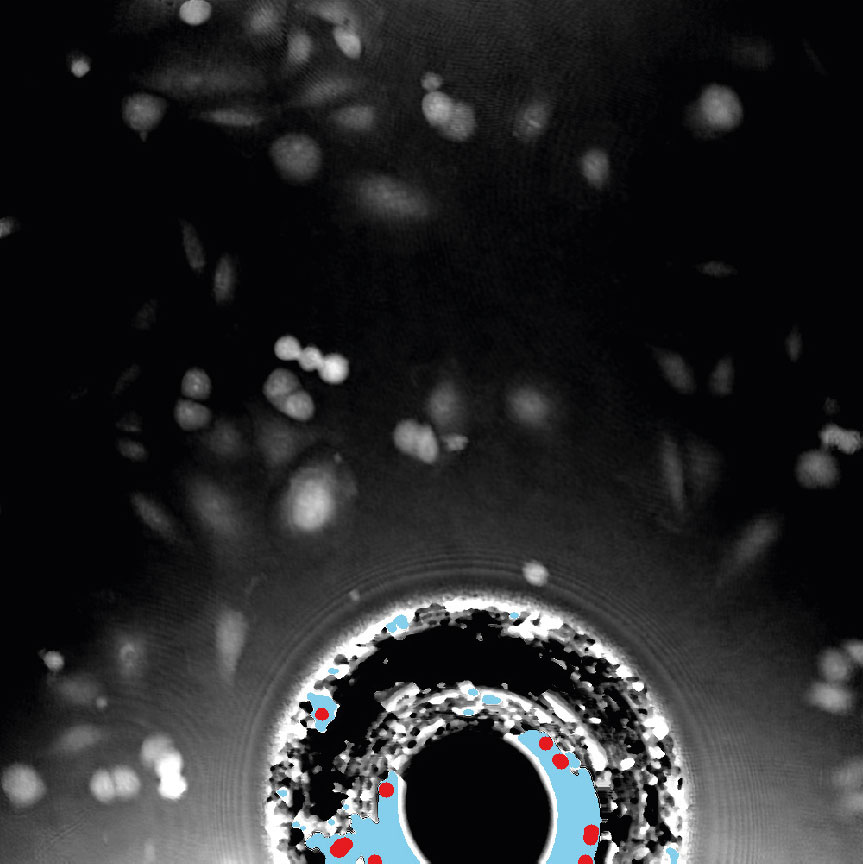
Condensation
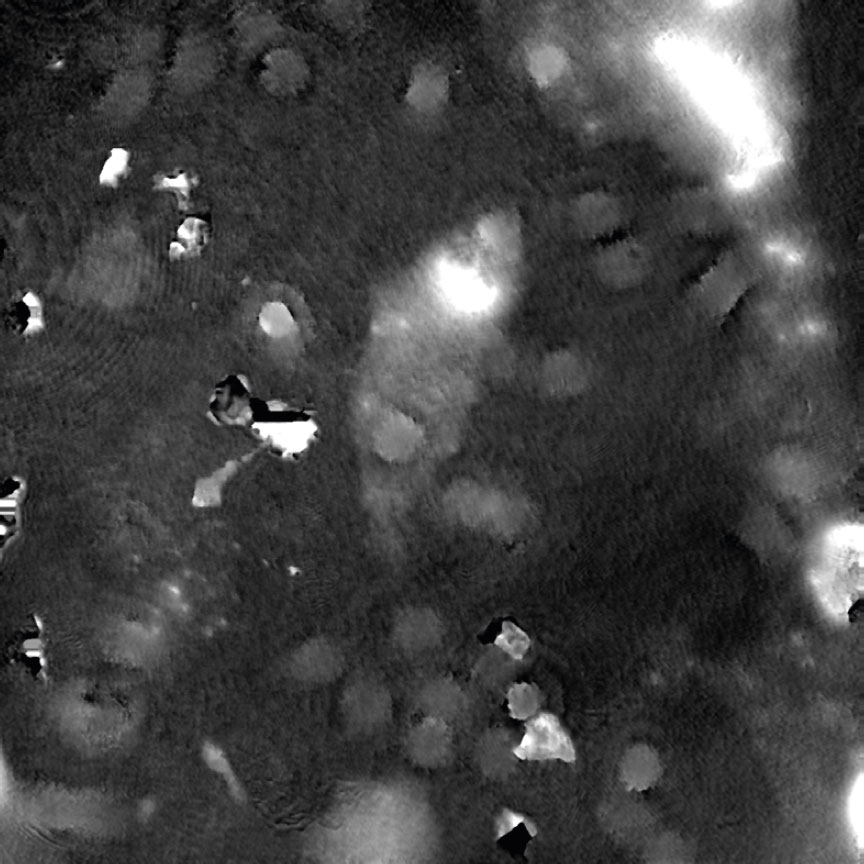
Tips to reduce condensation:
- Use pre-warmed cell culture media, as the cold one introduces a high probablity of condensation forming outside of the vessel. The condensation disappears once the media in a well is warm (1-2 hours after addition).
- Use HoloLids™ to eliminate image disturbances caused by condensation and surface vibrations inside the cell culture vessel. Details and user instructions are available in the HoloLids™ protocol.
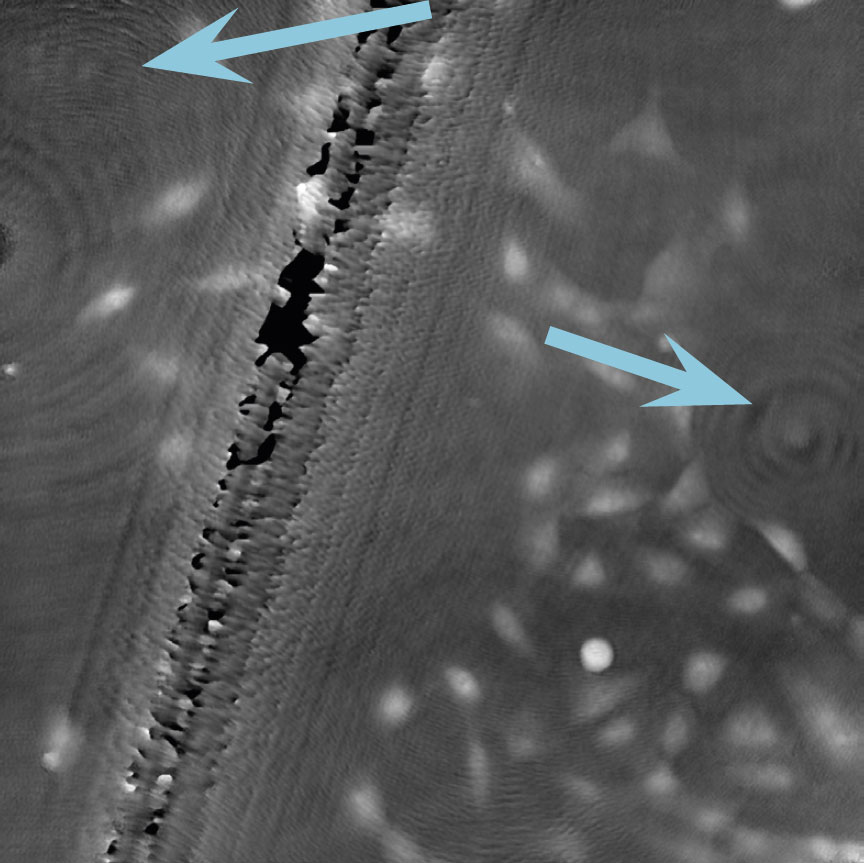
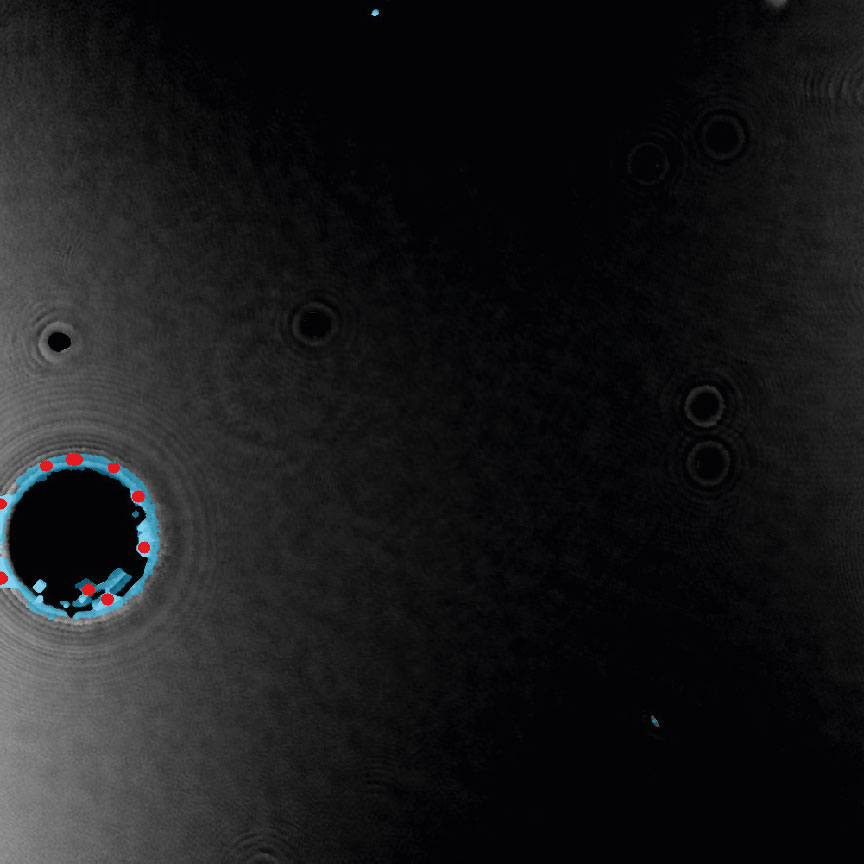
Dirt and particles
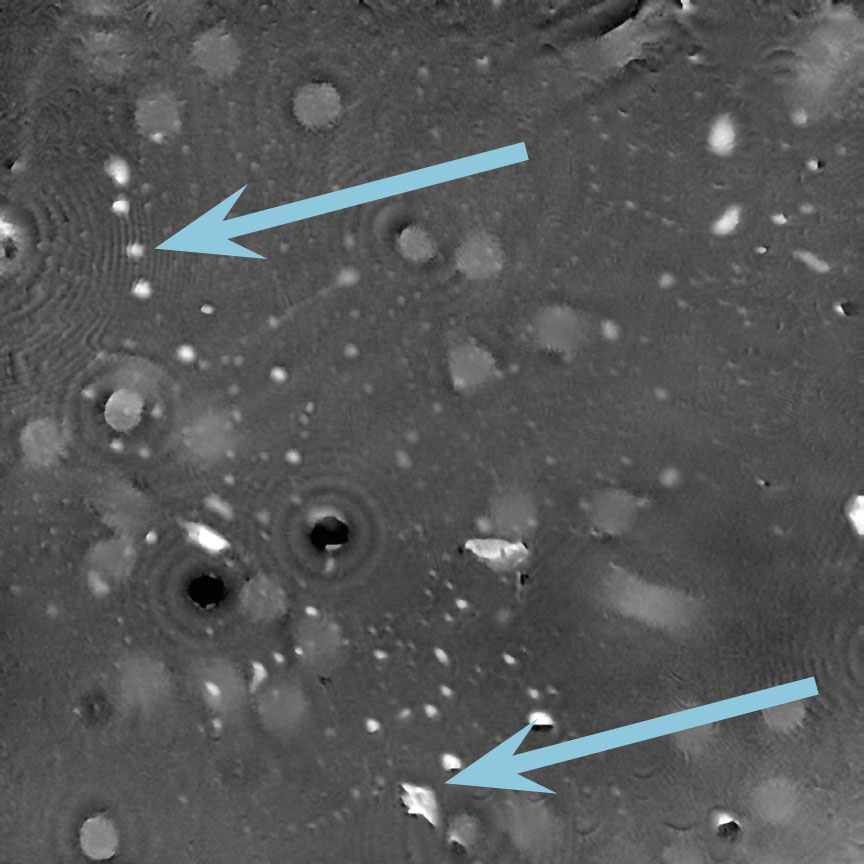
Tips to avoid dirt and particles:
- Never use paper or fabric to remove liquid drops or condensation. Fibers will stick onto the cell culture vessel.
- Always work in a clean environment – use LAF-bench to prevent dirt particles getting into the cell culturing media.
- Clean the HoloMonitor® M4 outer surfaces according to the Setup and Operation Manual.
- It is recommended to service HoloMonitor M4 yearly. For more information contact technical support (by writing an email to support@phiab.com) or your local distributor .
Airbubbles, smears and scratches
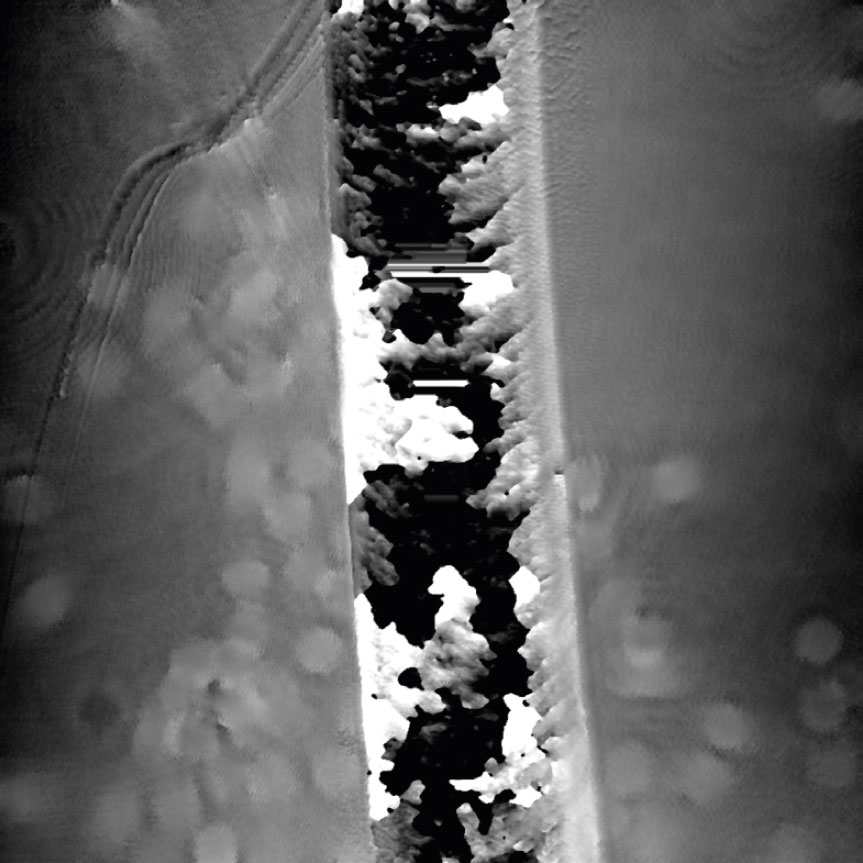
Tips to prevent airbubbles, smears and scratches:
- To remove airbubbles use clean air. This can be created by using an ethanol dispensing bottle with inner tube removed, and which contains on a small volume (100-150 mL) of 70% ethanol. Press the bottle carefully while directing the air stream towards the bubble. Do not touch the cell media.
- To prevent smears – always wear laboratory gloves.
- To prevent smears and scratches – only hold the cell culture vessel at its sides and do not touch the vessel bottom or lids.
Low optical quality plastics of cell culture vessels
Tip to avoid low quality plastic:
- Consult HoloMonitor® M4 recommended cell culture vessel list to learn more about which vessels have been tested and are compatible with HoloMonitor® M4.
Result analysis
Guided Assays
When the capture finishes, click the Show Result button to get directly to the Experiment Results page.
The assay results are generated during image capturing. The software automatically analyzes quantitative data generated from each image.
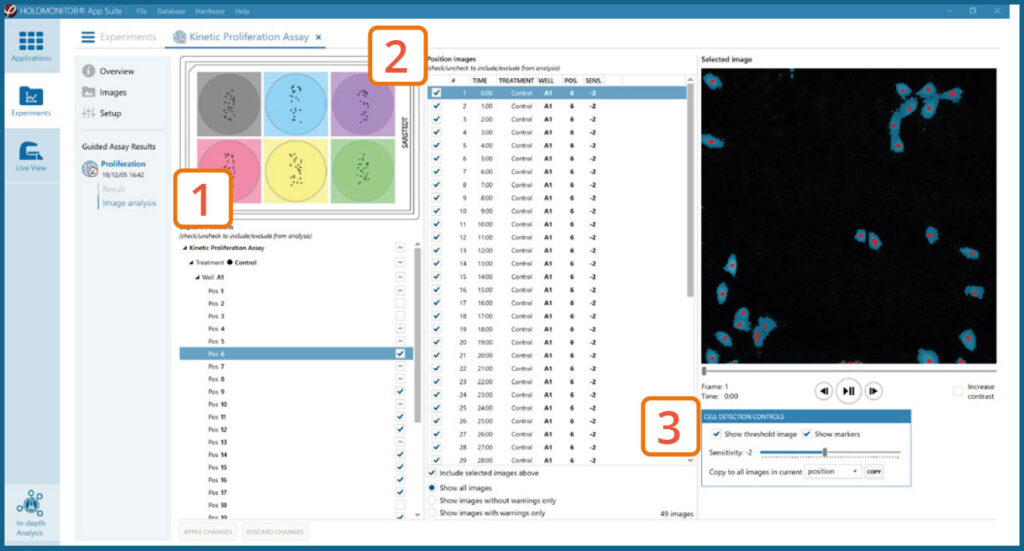
Image analysis tab
- An image analysis algorithm filters out images of poor quality and excludes them from results data.
The captured images from the experiment are displayed in a tree-view list. Clicking an item in the tree will show a list of all images contained in the selected level/category.
Checked check boxes — all images are included.
Empty check boxes — all images are excluded.
Check boxes with a dash — some images are included.
Symbols in the list show cell analysis (yellow exclamation mark) or image quality (red exclamation mark) warning.
It is possible to adjust the Sensitivity of image(s) and
view the image threshold and markers.
- It is users responsibility to verify that the software algorithm was correctly applied during image analysis and that results are accurate.
- User can choose to adjust sensitivity of the image threshold, and to include or exclude images from results analysis.
- For more information, see the Image Analysis Section in the Setup and Operation Manual for HoloMonitor® M4.
Below are some examples on how to improve image analysis by adjusting the sensitivity of the image and therefore the threshold of cell detection. Additionally cases, when the frames should be excluded from the analysis by unchecking the check box, are shown.
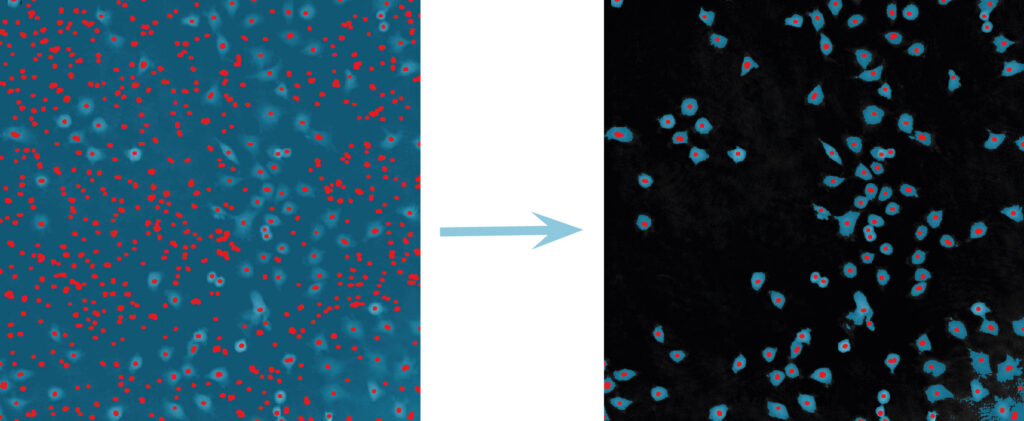
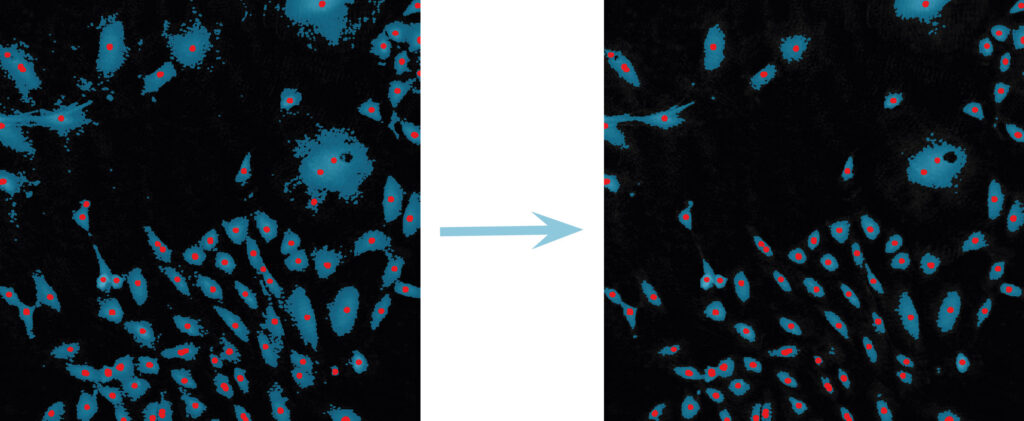
Adjust cell detection sensitivity
Examples of frames that should be excluded from Analysis
In-Depth Assays
When the Experiment capture finishes, click the Show Result button to get directly to the Experiment Overview page.
Generate in-depth analysis data from the captured images by selecting one of the applications icons.
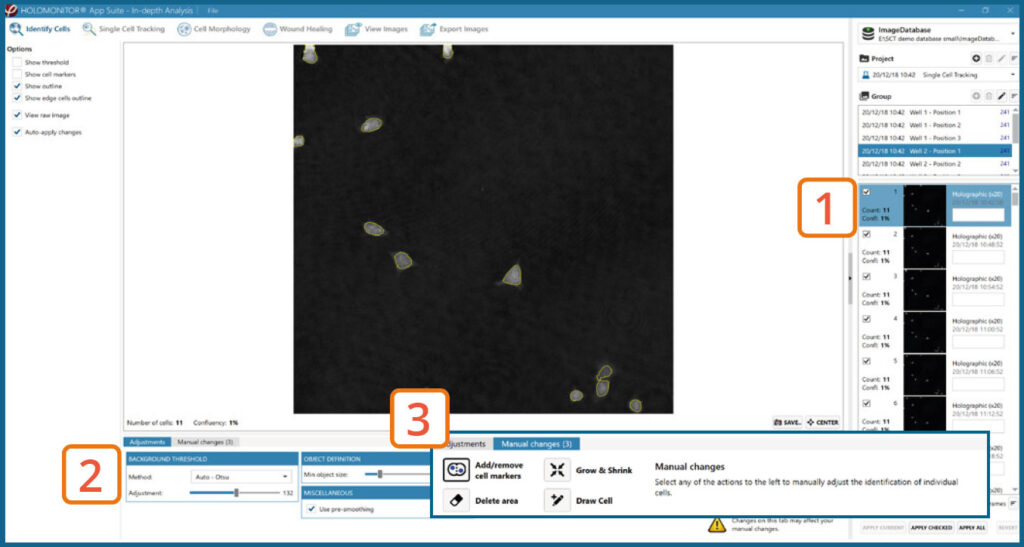
In-depth analysis – Identify cells tab
- First step is to identify the cells.
- Inspect the image quality and include/exclude frames from the analysis.
Start by selecting a frame of interest, so the image is displayed. You can alter the viewing options.
Adjust the background threshold and object size so the mask best fits the cell segmentation and click Apply (Current/ Checked/ All) to fix the settings to the frames and to display the automatic calculation of cell count (#/frame) and confluence (%).
Manual changes are possible. Add/remove cell markers or grow/ shrink a cell outline, delete a cell area or draw a cell area yourself. These changes will only be saved to the currently selected image.
View the full Cell Morphology and Single Cell Tracking protocols for further in-depth analysis steps.
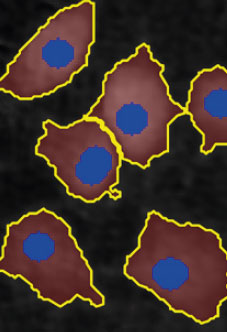
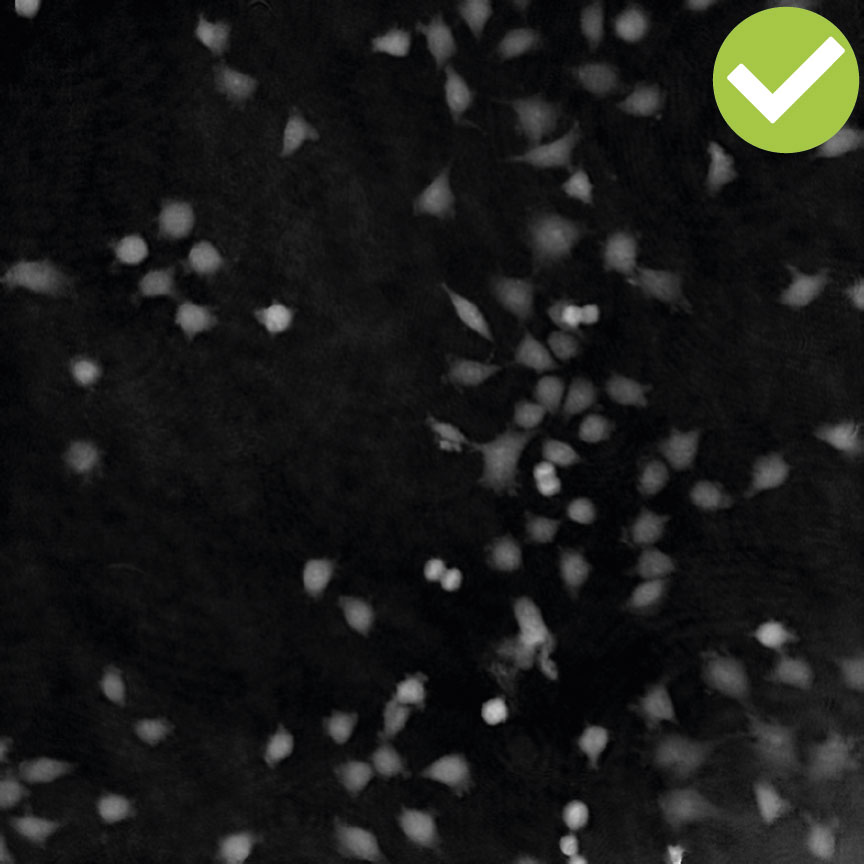
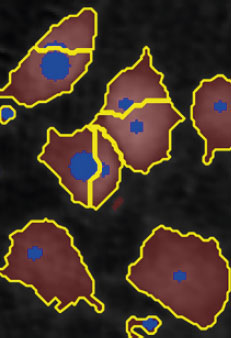
Threshold: OK
Object size: OK
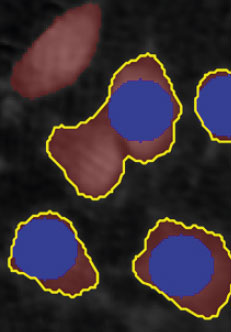
Threshold: OK
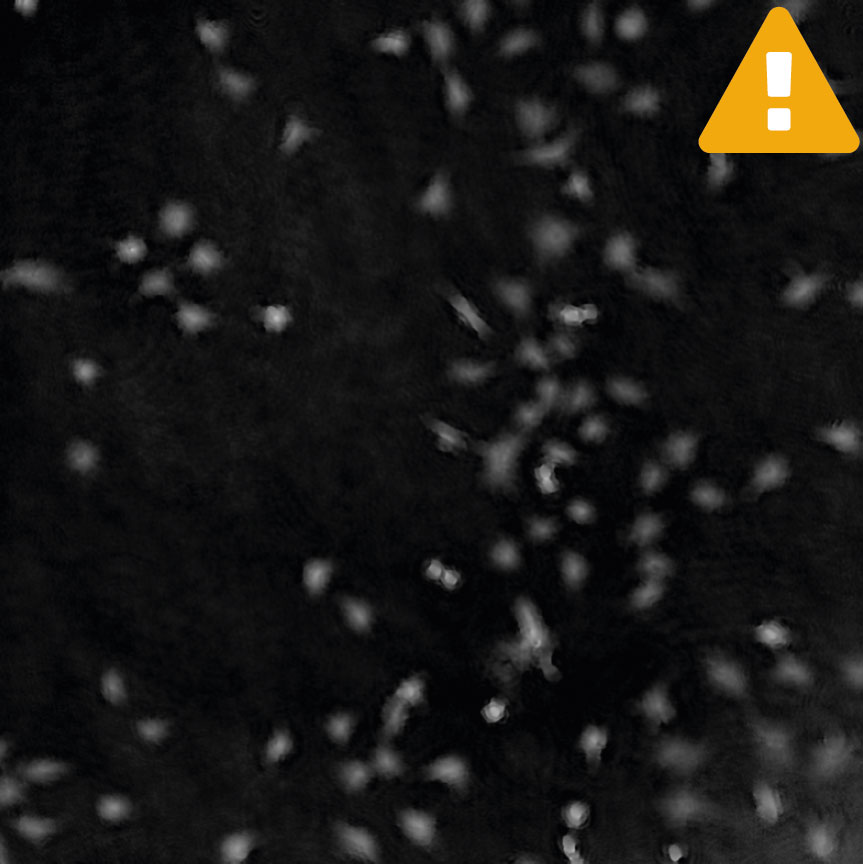
Object size: too big,
cells are missed out
or clumped together.
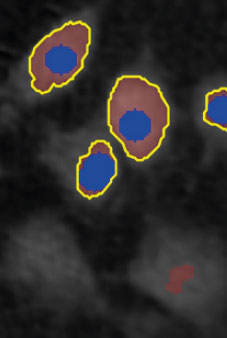
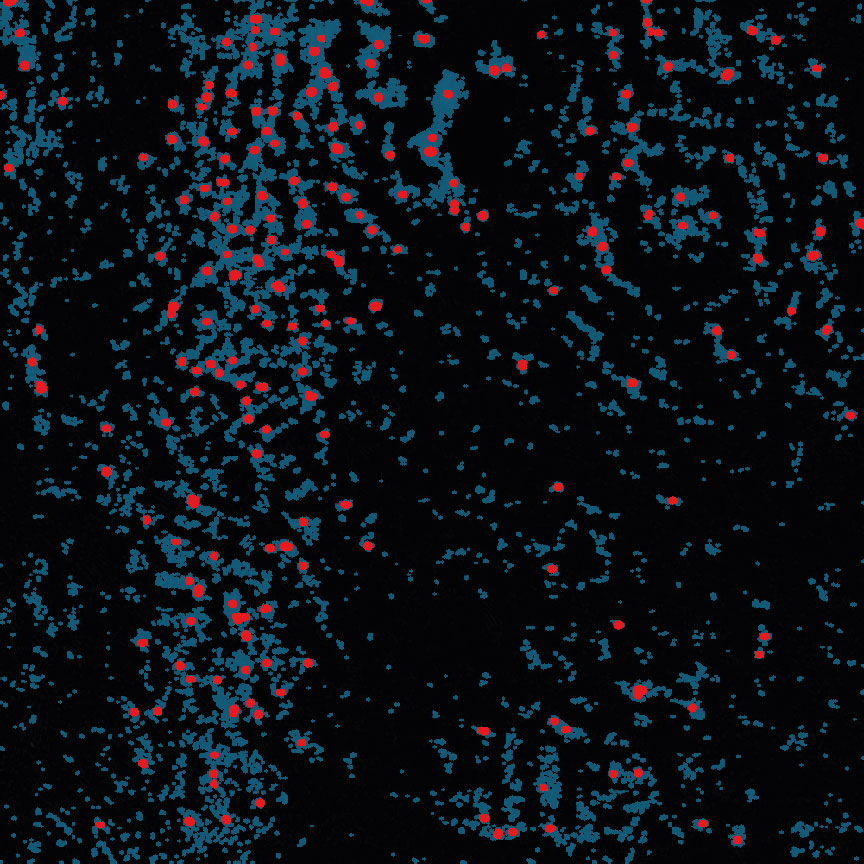
Threshold: too high,
missing out on cells
Object size: OK
Threshold: OK
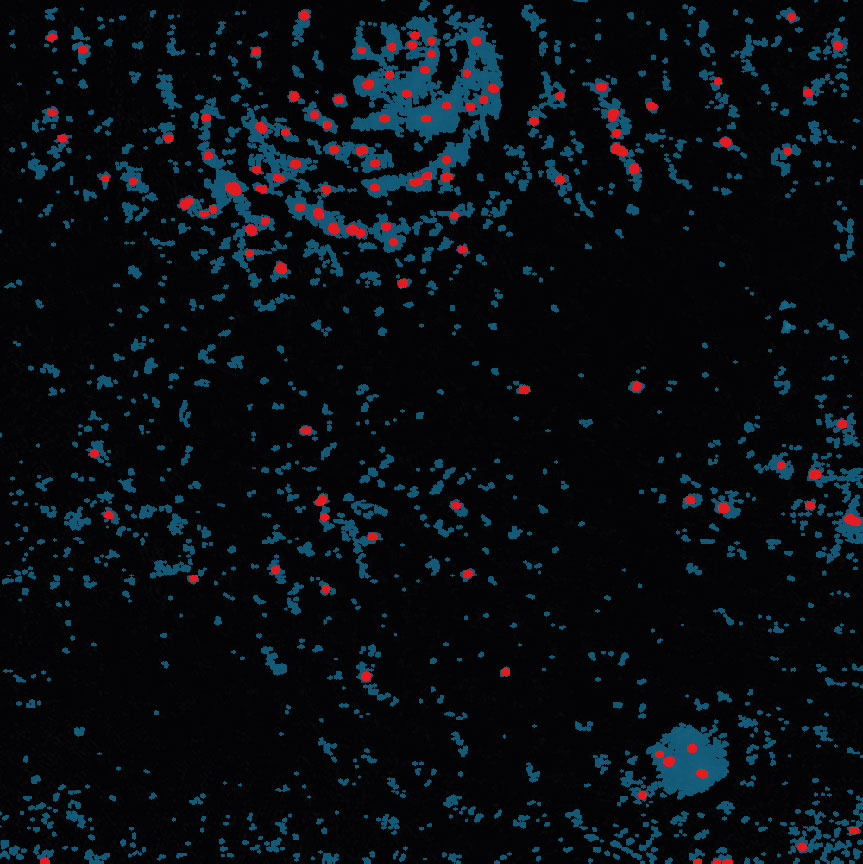
Object size: too small,
cells are fragmented
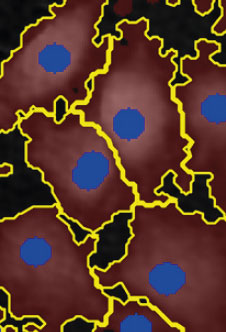
Threshold: too low,
too much background
included
Object size: OK
- It is users responsibility to verify that the software algorithm was correctly applied during image analysis and that results are accurate.
- Check cell segmentation for images throughout the experiment to make sure the applied threshold fits.
- The more thorough the user is in this step, the better analysis results are in the following steps.
- It is important for in-depth analysis that identifying the cells is done correctly.
- For more information, see Identify cells in the Setup and Operation Manual for HoloMonitor® M4.
In-depth analysis – Wound healing tab
Check the image quality before adding frames to the Wound healing analysis.
Adjust the image threshold and object size and click Apply to all frames.
View the full Wound Healing protocol for further in-depth analysis steps.
Threshold: too low, too much background included
Threshold: too high, missing out on cells
Threshold: OK
- It is users responsibility to verify that the software algorithm was correctly applied during image analysis and that results are accurate.
- Check the mask coverage for all the images throughout the experiment to make sure the applied threshold fits correctly.